The health of the consumer has been a concern all year, so MoneyShow’s Tom Aspray takes a technical look at four consumer ETFs to determine if there are reasons to worry over consumer sentiment as we head into the summer.
While last Friday’s rally helped encourage the stock market bulls, the weak follow through on Monday was consistent with a rally failure based on the technical evidence presented yesterday.
The market internals were quite weak with almost 4 times more declining stocks than advancing ones. The NYSE A/D line has now closed below last week’s low after failing Monday to rally above its declining WMA. This is consistent with a further decline in the major averages and only a strong market reversal to the upside would reverse the deterioration.
The ISM Non-Manufacturing Index came in stronger than expected Tuesday at 57.8 while most were looking for a decline to 56.2. Later today we get the ADP Employment report with the focus now on Friday’s monthly jobs report. Another weak jobs report may increase investor concern that the economy’s strength does not justify the current stock market levels.
The health of the consumer has also been a concern all year and a technical look at four consumer ETFs does raise some concerns over consumer sentiment as we head into the summer.
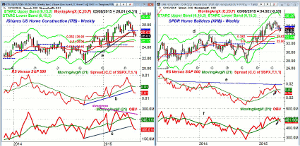
Chart Analysis: The iShares US Home Construction (ITB) has total assets of $1.95 billion with an expense ratio of 0.45%. The ETF has 37 holdings with over 10% in DR Horton (DHI) and Lennar Corp. (LEN) and is focused on the major home building stocks. There is 61.1% in the top ten holdings.
- ITB is up just 0.58% YTD after gaining 4.6% in 2014.
- The ETF had a high of $28.82 in early April and broke its uptrend, line a, last week.
- ITB is now down 9.7% from its high and has reached the 38.2% Fibonacci support at $25.90.
- The 50% support is at $25 with the weekly starc- band at $25.13.
- The weekly relative performance broke its uptrend last week, line b, and is well below its WMA.
- The weekly OBV formed a bearish divergence at the recent highs.
- This has been confirmed by the break of the OBV support at line c.
- The quarterly pivot is at $26.94 with the declining 20-day EMA at $26.98.
The SPDR Homebuilders ETF (XHB) has total assets of $1.52 billion with an expense ratio of 0.35%. It has a much different composition than ITB as the 35 holdings are concentrated in the home furnishing and home construction material stocks. The largest holdings are in Aaron’s Inc. (3.8%) and Temper Sealy (3.5%) and there is 33.6% in the top ten holdings.
- XHB is up 2.46% YTD but was up just 3.3% in 2014.
- The weekly chart shows a breakout above resistance, line d, in early 2015.
- The breakout level is just above the 38.2% retracement support at $33.62.
- The weekly starc- band is at $33.44 with 50% support at $32.50.
- XHB also closed last Friday below its quarterly pivot at $35.54.
- The weekly RS line turned lower from resistance, line e, going back to 2013.
- The RS line has now dropped below its WMA.
- The weekly OBV shows a similar rally failure at resistance, line f.
- The OBV formed a short-term divergence at the recent highs and has dropped below its WMA.
- The declining 20-day EMA is at $35.62.
Next Page: Two More Consumer ETFs to Watch
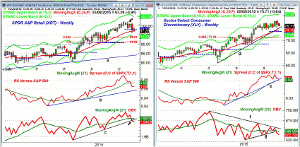
|pagebreak|The SPDR Retail ETF (XRT) has total assets of $1.08 billion with an expense ratio of 0.35%. There are 101 holdings in the portfolio with just 11.7% of the assets in the top ten holdings, Diplomat Pharmacy (1.3%) and Netflix (1.2%).
- XRT is up 1.68% YTD and was up 9.86% in 2014.
- The early 2014 highs at $96.82 were tested last week.
- The weekly chart shows that a LCD sell signal was triggered three weeks ago (see arrow).
- The 38.2% Fibonacci retracement support is at $93.91 with the starc- band at $94.24.
- The 50% retracement support is at $91.28.
- The weekly RS line did make a new high with prices and dropped below its WMA last week.
- The relative performance has long-term support at line b.
- The weekly OBV does look weaker as it has dropped below its WMA and the uptrend, line c.
- The quarterly pivot is at $98.09 with the declining 20-day EMA at $99.24.
The Sector Select Consumer Discretionary (XLY) has total assets of $10.76 billion with an expense ratio of 0.15%. There are 85 holdings in the portfolio with 45.8% of the assets in the top ten holdings Walt Disney (7.4%) and Amazon.com (6.9%).
- XLY has been leading the SPY higher in 2015 as it is up 5.26% YTD and was up 9.46% in 2014.
- The weekly chart shows it has been in a range for the past eleven weeks as it made a new high last week at $77.89.
- The support from the 2014 and the 2015 lows is at $75 (line d) with the 20-week EMA at $74.15.
- XLY has been above its quarterly pivot, now at $73.58, since last October.
- The 38.2% support is at $71.39.
- The weekly relative performance is still in a solid uptrend, line e, consistent with a market leader.
- In contrast, the weekly OBV has been diverging from prices, line f, since last year.
- The OBV has dropped below its WMA.
- XLY did close below its 20-day EMA at $76.16 on Tuesday.
What it Means: The recent weakness in the home building and home furnishing stocks is a concern as growth in the housing market is important to keep the economy strong. It will be important to see if the SPDR Retail ETF (XRT) can hold its next support levels.
This analysis illustrates the importance of carefully analyzing any ETF and its holdings before you buy. For example, the SPDR Homebuilders ETF (XHB) has less of a focus on the home construction stocks but is more diversified.
The bright spot has been the Sector Select Consumer Discretionary (XLY) which has been holding up quite well so far. A daily close below $74.53 would be a sign of weakness.


