
Major bull market peaks are often unexpected and seemingly impossible to predict, but they all share some common characteristics that, when recognized, can help investors navigate the topping process, points out Jim Stack, money manager and editor of InvesTech Research.
While market tops do not play out in precisely the same way each time, there are consistent signals which usually emerge well in advance of any serious portfolio losses. In the following pages, we will explore the most common and important warning signs and evaluate where each stands today.
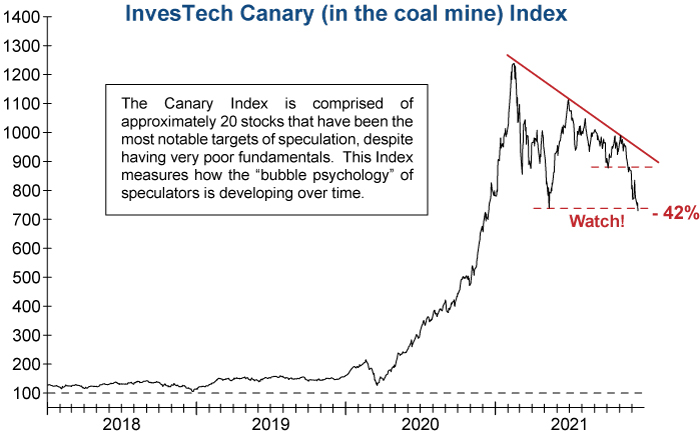
Excessive speculation often occurs in late-stage bull markets, and signs of an unwinding of these high stakes positions indicates that trouble in the broader stock market may lie ahead. The incredible buying frenzy that gripped investors during 2020 was truly unique in that extreme speculative behavior, indicative of a late-stage bull market, occurred in what was a new technical bull.
Our InvesTech Canary (in the coal mine) Index — which tracks 20 of the most notable favorites of today’s speculative crowd — is currently signaling a serious slowdown in this risky behavior. Since screaming to a peak in February of this year, the Index has been in a volatile downward trend.
It recently plunged through initial support and has just broken under its critical support level set in May. If it fails to regain this support level in the coming weeks, it will be a strong confirmation that the speculative peak is in place and could suggest that the market topping process is already underway.
Deteriorating breadth has historically been one of the most reliable signs of trouble ahead for the stock market. When market breadth narrows, it signals internal weakness as investors grow more selective in their stock purchases.
This dynamic has typically created a negative divergence in the Advance-Decline (A-D) Line prior to past major market tops. One of the most significant warnings from the A-D Line came in the final stages of the 1990s Tech Bubble. The divergence in breadth began in early 1998 as investors became increasingly focused on leading stocks of the “new era.”
Today, the A/D Divergence Index is making new lows, signaling notable deterioration in market breadth relative to market gains over the past six months. This degree of internal weakness is not as evident in the current A-D Line.
Roughly two-thirds of the S&P 500’s gain this quarter is attributable to just 10 stocks, primarily mega-cap momentum names such as Tesla (TSLA), Apple (AAPL), Nvidia (NVDA), and Google (GOOGL).
Our Model Fund Portfolio is already preemptively defensive and carries a focus on sectors and industries that can benefit from higher raw materials prices and have inherent pricing power. It also underweights or avoids areas more susceptible to higher labor and input costs, as well as rising interest rates.
An equal-weighted approach in the Technology, Communications, and Consumer Discretionary sectors ballast the portfolio by avoiding the most overvalued segments of the market.
Our model portfolio includes Invesco S&P 500 Equal Weight Consumer Discretionary (RCD) and Invesco S&P 500 Equal Weight Technology (RYT) — as well as Fidelity Select Telecommunications Portfolio (FSTCX) and Communication Services Select Sector SPDR (XLP).
We believe this is the most interest rate-sensitive equity market in history, and as the backstop of an extremely accommodative Federal Reserve is being withdrawn, we are entering a period of higher risk and volatility moving forward.
This is no time for complacency. The most important message today is to avoid the high risk speculative stocks in this toppy-looking market, and to reduce exposure in the heavily over-invested institutional favorites; they might all be great companies, but they are very richly priced in a high risk market. When it comes to the early stages of a possible bear market, what you don’t own is often more important than what you do own.


