
We coined the term “bear-killer” for October way back in 1968 in the 1969 Stock Trader’s Almanac, the second edition. The original theory from the 1969 Almanac still holds water, recalls Jeffrey Hirsch, editor of Stock Trader's Almanac — and a participant in The MoneyShow Orlando, October 30 to November 1. Register here.
October has been the big bargain month of the post-World War II era. Its chief asset is its enviable position in the calendar. It falls in front of the most bullish three-month span of the year (November, December and January).
At this time, volume picks up considerably and there is a great seasonal demand for stocks. The annual surge of investment funds into the market has helped stem the tide of major bear markets enabling October to become the “bear-killer.”
In addition, so many stalled bull markets seem to get moving again during this month. Twelve post-WWII bear markets have ended in October: 1946, 1957, 1960, 1962, 1966, 1974, 1987, 1990, 1998, 2001, 2002 and 2011 (S&P 500 declined 19.4%). Seven of these years were midterm bottoms.

Amazing how little this has changed in 54 years despite the many systemic changes to the market, technological advances and shifts in collective human behavior and behavioral advance. The negative seasonality in September and volatility in October that creates “Octoberphobia” and turned October into a “bear-killer” comes from fund tax selling, end of Q3 window dressing and portfolio restructuring.
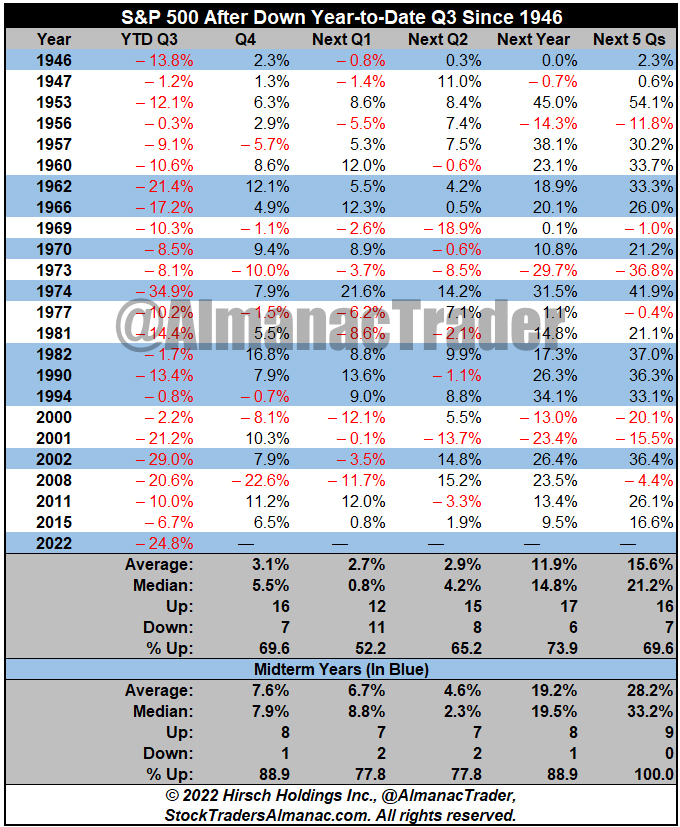
S&P 500 closed September down -24.8% year-to-date – the 4th worst YTD Q3 performance since 1930. Since WWII (1946) when S&P 500 was down YTD at the end of Q3 in midterm year it gained 28.2% on average over the next 5 quarters with no losses.
In all 23 years the following Q4 was up 69.6 % of the time for an average gain of 3.1%. Subsequent Q1s were up only 52.2% of the time for an average gain of 2.7%. The following Q2s gained ground 65.2% of the time for an average gain of 2.9% and then next years were up 73.9% of the time for an average gain of 11.9%.
But the record for midterm years down at the end of Q3 is better. Of those nine midterm years highlighted in blue in the table only 1946 into 1947 had no bounce with 1947 closing exactly at the same price as 1946 for S&P. Overall, Q4s were up 88.9% of the time, average gain 7.6%, Q1s up 77.8% of the time, average gain 6.7%, Q2 up 77.8% of the time, average gain 4.6% and next years up 88.9% of the time, average gain 19.2%.
So, while things look grim out there on Wall Street, economically and globally, odds are we are nearing a bottom and the prospects for Q4 and next year are encouraging, at least historically, seasonally and 4-year cycle-wise. Make no mistake headwinds remain numerous, and volatility is likely to persist in the near-term with some back fill of recent gains a possibility. But the market is forward looking, and the worst is either past or will soon pass.


