Once the outcome of the midterm elections is known, it will likely alleviate some of the uncertainty that has been contributing to the market’s volatile trading, observes Jeff Hirsch, editor of Stock Trader's Almanac — and a participant in MoneyShow's Post-Election Virtual Expo on November 10-11. Register here for free.
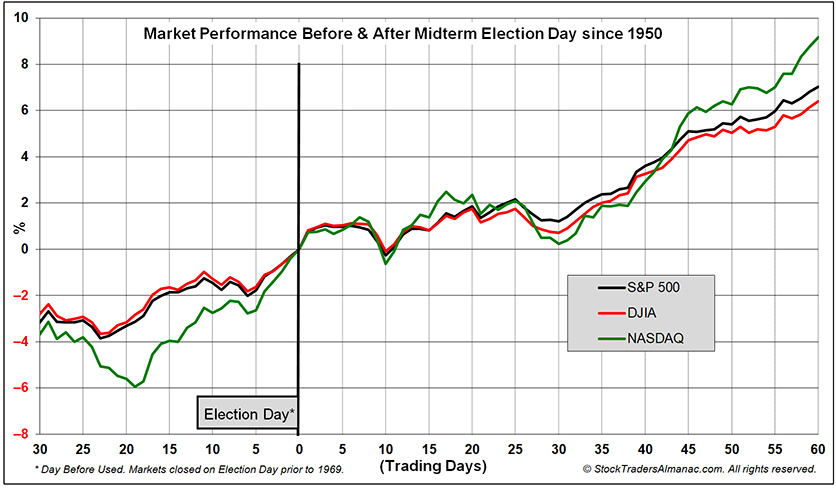
In turn, this could help the market snap out of the current Fed-induced funk. In the following chart the 30 trading days before and 60 trading days after the last 18 midterm-year elections appear (NASDAQ since 1974).
Prior to 1969 the market was closed on Election Day so the close on the day before was used. By 60 trading days after the election (approximately three months), DJIA, S&P 500 and NASDAQ were all higher on average from 6.4% to 9.2%.

Digging deeper into the data, the S&P 500 performance 1-, 3-, 6- and 12-months after the election, we see that 1- and 3-months after the election the S&P 500 was higher 77.8% and 88.9% of the time respectively. By 6-months and 1-year after, S&P 500 was always higher, although gains did slow after 6-months.
Meanwhile, the "Sweet Spot" of the 4-year cycle is now. The headwinds that abound this time around are not entirely unlike past midterm years that have historically been mired by bear markets and uncertain economic and political times.
Many of the current concerns do appear to be accounted for by the market’s declines coming into Q4. Inflation does remain stubbornly high despite the Fed aggressively raising rates this year.
The Fed’s most recent statement may not have been as dovish as some had hoped for, but it did contain language that suggested the time to slow the pace of increases and possibly even pause hikes is closer now than it was six months ago.
The market is likely to remain volatile as it awaits more clarity from the Fed and more signs that inflation is easing. Any back and fill periods by the market are likely an opportunity to consider adding to existing long positions or establishing new longs.


