
Now that the S&P 500 is on target to post a positive performance for the month of January, after selling off during the first week of the year, investors are breathing a sigh of relief. There is an old saying on Wall Street: “As goes January, so goes the year,” notes Sam Stovall, chief investment strategist at CFRA Research.
Since WWII, whenever the S&P 500 rose in price in its opening month, the market was up an average of 16% for the entire year, rising in price 85% of the time (with an average 11.4% gain coming during the remaining 11 months of the year).
What’s more, for the nine election years with positive January returns, the S&P 500 gained an average of 15.6% and rose in price 100% of the time. Finally, the “January Barometer” reminds us to “let your winners ride.”
S&P 500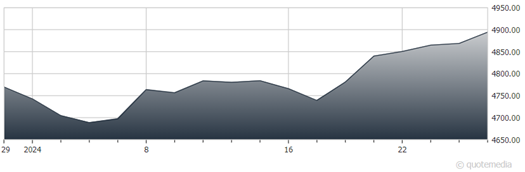
Since 1990, the three sectors with the highest returns during an “up” January went on to record an average full-year price increase of 21.2% versus 15% for the S&P 500, advancing in price 95% of the time (versus 79% for the market), and outpaced the broad market 84% of the time.
Even though there is no guarantee that this will repeat, this pattern offers encouraging implications for the current front-runners: Communication services, financials, and information technology. Year to date through Jan. 25, the S&P 500 rose 2.6% in price, accompanied by gains for the growth and value indices, along with five of 11 sectors.
Underperformers included the mid- and small-cap indices, as well as the materials, real estate, and utilities sectors. Finally, 42% of the S&P 1,500’s 153 subindustries advanced in price, led by interactive media & services, movies & entertainment, and semiconductors. Laggards included agricultural products & services, automobile manufacturers, and diversified metals & mining.


