
The streak is broken. Five consecutive months of gains came crashing to an end in April. But that was to be expected...at least from our perspective. Now May is at the door. My work suggests “Sell in May and Go Away” is just another of a growing list of debunked market myths, writes Matthew Carr, editor of Tipping Point Profits.
In May, the paddock on my farm becomes a field of yellow, conquered by buttercups on the march. The temperature is rising. All around, the countryside is dressed in a spring coat of lush green. And we find ourselves confronted with the most infamous month of the year for stocks…May. For those in dire need of an excuse to be bearish the month has long been an investor favorite to avoid.
But is there truth to this idea? Or is it one of the market’s most misunderstood myths and pearls of wisdom?
The “Sell in May” concept originated in England, when aristocrats, bankers, and other wealthy elites would flee the suffocating heat of London to summer in the countryside. And they wouldn’t return until after the St. Leger Stakes – the final race in the British Triple Crown – on September 15.
The expression carried over to the US where most people take vacations between May and September. The idea was investors pared their exposure to the markets in these months by having their money take a vacation as well. That meant a summer lull as volume sputtered to a trickle. And it wouldn’t normalize again until after the summer ended and children went back to school, around Labor Day.
For decades, the theory seemed efficient enough. From 1950 to 2022, the Dow Jones Industrial Average averaged a meager 0.8% return from May to October. Meanwhile, the blue chips went on a charge from November to April, gaining an average of 7.3%.
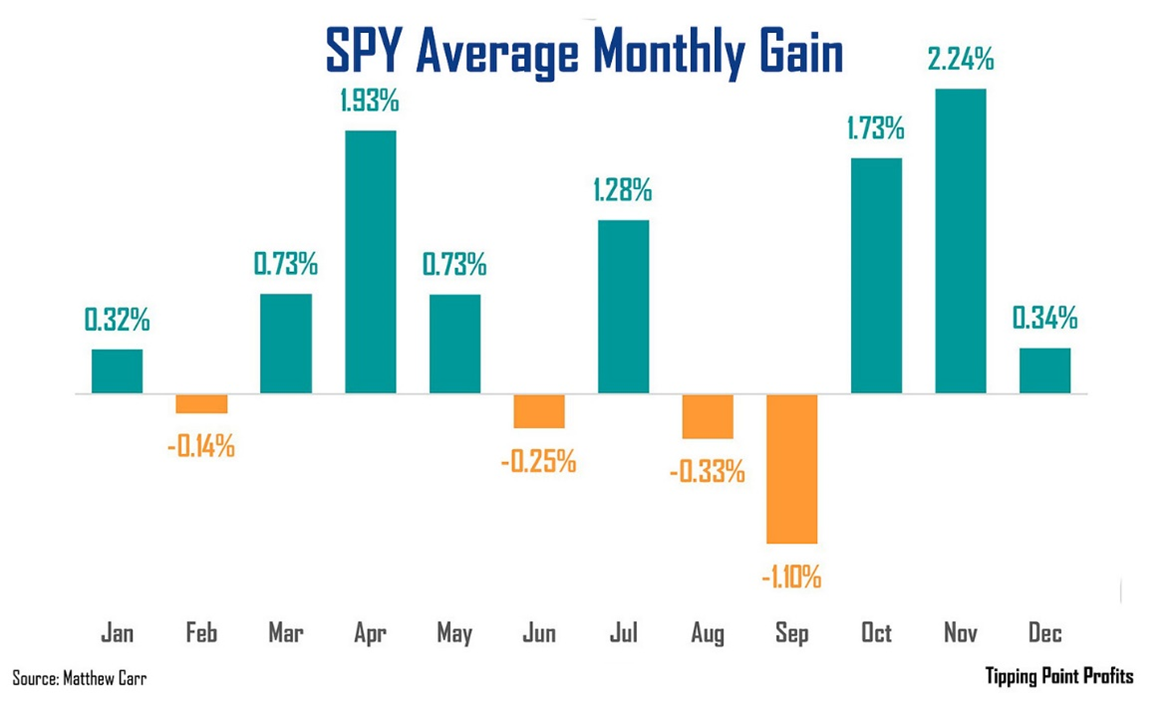
And when we look at the stretch of average monthly gains for the SPDR S&P 500 ETF (SPY) since 1993, the period from May through September doesn’t look very promising. Three of the four worst months of the year for large-cap international stocks occur in that five-month span.
But by no means does that mean to completely buy into the “Sell in May” philosophy…because if you do you could be missing out on gains. In fact, since 2014, the success rate for a gain on the SPY from May through October is 80%. That’s actually better than the 70% success rate of November through April during the same span.
And since 1993, the average gain on the SPY from November through April is 6.49%...only slightly better than the average gain of 5.38% from May through October.
One possible reason? Everyone is now connected to the markets 24/7, 365. Even on vacation – whether it’s in May or in November - investors can place trades.
Bottom line: It’s not the greatest month of the year for stocks. But it’s far from the worst. And in election years, we see it holds steady instead of crumbling under the weight of anxiety and fear.
Recommended Action: Buy SPY.


