We’ve already heard comparisons in terms of the fear, panic, confusion, and volatility of May 6, 2010 to October 19, 1987, so let’s look at the pure price charts to see if the comparison extends beyond that.
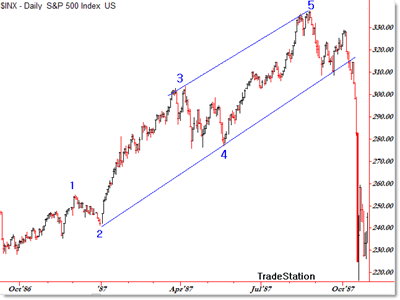
First, a look at the daily S&P 500 chart showing the run up and crash of 1987:
I cheated a little bit and added a five-wave Elliott count and a parallel trend line channel to the chart, but you can see the structure that took us to the 1987 top prior to the crash.
Even today, some traders refer to the 1987 crash as a one-day event, but price began a downward path, peaking almost two full months earlier on August 25, 1987 at 335.
Price formed an initial downswing, retraced it in an ABC pattern back to 330, and then crashed, being down eight of the nine trading sessions before the October 19 crash day.
We had a similar looking pattern, but on a smaller scale than 1987…but that’s a different story.
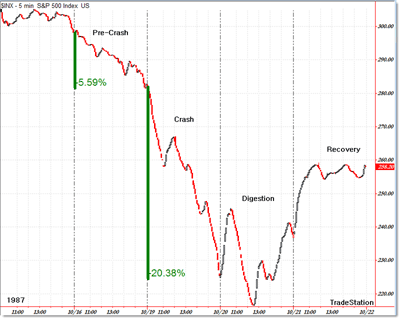
Let’s compare the intraday chart of the crash day and then immediate reaction after the crash to see how today and then compare.
The market actually began careening out of control after breaking the key support at 300.
The market fell 5.5% on the day prior to the crash, then fell 20% on the day of the crash, falling with minor rallies during the course of the relentless selloff.
Price rallied sharply off the open the next day, then crashed to a new low at 220, which was the final low before a snap-back rally occurred.
Price peaked as you see it here at 260, then spent the next two months in a very volatile chop that took price down, then up, then back down to retest the low, forming a final bottom on December 4 at 221.
The market rallied sharply from then.
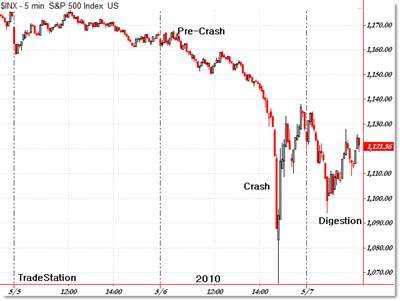
What about our five-minute chart currently?
The key level this time was 1,150, though we had a mini pre-crash before sellers broke through that level.
After buyers lost the 1,150 support, it created a violent positive feedback loop with bulls taking stop losses (exiting/selling) and bears now short-selling, combined with what they’re calling a computer glitch (similar to the portfolio insurance program selling of 1987) and you get another market crash that stunned the public.
Now we are in the digestion phase, which is giving us violent swings as price winds down to find balance again.
This is not an environment for new traders to be rushing out to 3x leveraged funds to try to make a fortune in the volatility. It is a time for capital preservation and safety as the professionals try to make sense of what’s happened, whether it was an isolated one-day event, or whether this may be the start of something larger.
If the 1987 crash pattern repeats, we could see a nice rally. But keep in mind that the crash scenario took over after we broke down through 1,150, so we’re not that far from that level now (or by the previous close).
Stay safe, trade conservatively, and don’t get trapped on the wrong side of a volatile move.
By Corey Rosenbloom of Afraid to Trade


