After a solid rally, steel stocks have trended steadily lower, and a look at the charts for three top steelmakers shows the likelihood for continued downside potential.
Steel stocks have been attracting some attention lately, as they are approaching their 200-day simple moving averages (SMAs). As a group, they had a good run higher from December into January and have been trading in a broad range since, trending lower since February.
But the last two weeks have highlighted some differences in the most popular trading names—including AK Steel Holding Corp. (AKS), US Steel Corp. (X), and Mechel OAO (MTL)—and traders are scratching their heads about whether a base is being built to move higher or if the next leg down is about to happen.
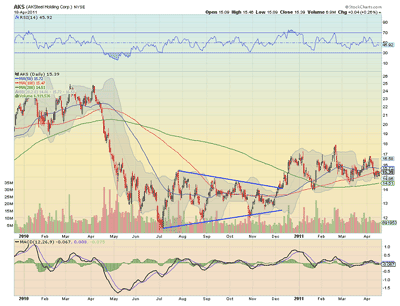
Let’s analyze the charts for each of these leading steel stocks. First, AK Steel Holding Corp. (AKS):
AKS is the strongest of the three. After moving higher into year-end, it has put in a series of three higher lows, all near the 100-day SMA.
It has been in a bear flag for the past week, and if it breaks that flag lower, then there is downside opportunity to the 200-day SMA at $14.51 and support at $14 before lower at $13.
If it bases and breaks the flag higher above the 100-day SMA, then there is resistance at the 50-day SMA and $16.80-$17 before higher at $19.
The Relative Strength Index (RSI) is hovering around the midline and the Moving Average Convergence Divergence (MACD) indicator is flat, both offering no insight as to the next move.
And that is the "strong" chart of the group!
NEXT: See Charts for US Steel and Mechel OAO
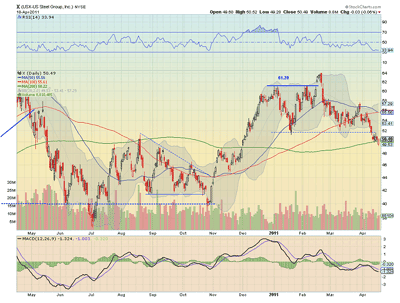
|pagebreak|Next, US Steel (X):
US Steel broke below support at $51.80 last week and found support at the 200-day SMA. On Monday, it looked like that support was lost as the stock fell below, but it recovered and finished back above the 200-day SMA, printing a hollow red candle, an indication of bullish intraday activity.
The RSI has flattened as it approaches the technically oversold level and the MACD is starting to improve.
Perhaps this stock has found a bottom and is ready to rise, but until it gets over $51.80, it is in no-man’s land.
Beyond that there is resistance at the 50/100 SMA cross near $55.55 and then $58 on the way to retesting the highs.
A close below the 200-day SMA would be bearish with a short target of $48.10 followed by $46 and $42.
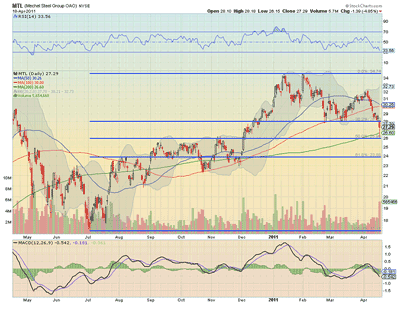
Finally, Mechel OAO (MTL):
MTL is the worst chart of the three and got kicked in the nuts and bolts on Monday with the rest of the market.
After the recent base over the 38.2% retracement of the move higher from July, it fell through, losing more than 8% at one point and finding support at the 50% retracement. It printed a hammer, or possible reversal candle, on heavy relative volume and closed back over the 200-day SMA.
If the hammer candle is confirmed by a move back above $28.03, then there is resistance at $29 and the area of the 50/100-day SMA cross at $30 before it can see the $32 level.
It is outside of the lower Bollinger band, so sideways consolidation or a move higher is likely, but failure to retake the Fibonacci will find support at the 200-day SMA and the 50% Fibonacci level before testing $25 on the low side.
The RSI is sloping down and the MACD is increasingly negative, showing favor to more downside potential.
By Greg Harmon, trader and blogger, DragonflyCap.com


