Rising energy prices and known seasonal patterns now taking effect could produce important shifts in equity and commodity markets, says veteran trader and analyst John Person.
Is technical analysis useful in today’s markets? I believe, by all means, it is. However, it is just a matter of how it is applied and which tools are used. As a recent example, last month we identified a resistance level in silver between $37.00 and $38.00 based on a variety of technical tools.
First, using simple Fibonacci retracement levels from two different time and price locations, we have what is called a “confluence of resistance” between the $37.35 and $37.95 level.
Secondly, I used simple trend line analysis that projected silver could hit that line near the $37.00 level.
Thirdly, I used one of my favorite bearish candle patterns, the “Red Opening Marabozu” formation. Generally speaking, markets will come back to test the midpoint of the real body (opening-closing range) and this can act as a resistance level.
And lastly, using past price action to determine the seasonal supply and demand functions was very useful.
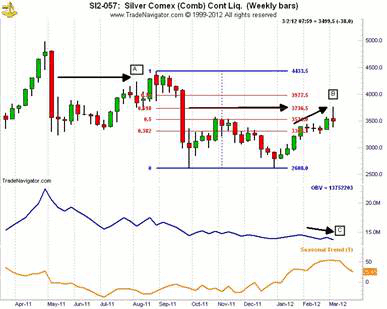
Take a look at figure 1 below, which is a weekly silver chart. Point “A” shows the midpoint of the red opening Marabozu candle’s real body (opening-closing range) acted as a resistance level. At point “B,” which is what I targeted as last months resistance level, see how the Fibonacci .618% retracement level intersected that price area as well.
At the lower quadrant of the chart, you will see the seasonal aspect for silver is to typically peak out in late February. In addition, the rally from the beginning of February to the high of $37.58 was on a decline in volume, or bearish divergence in relationship to the on-balance volume (OBV) indicator.
See related: OBV: The Perfect Indicator for All Markets
The issue is that the decline occurred in one day and did not give traders much time to adapt to the volatility. At the least using the analysis would have given a trader the idea not to buy at the $37.00- $38.00 level.

Now we enter March, the last month of the first quarter. From a seasonal aspect, we have many shifts in prices among a spectrum of markets.
See related: The 4 Key Seasonal Trends for 2012
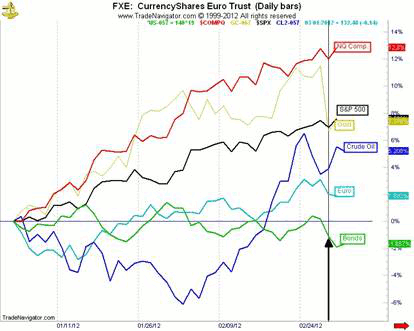
First let’s take a look at the top markets’ performance from a year-to-date basis, as shown in the figure below. The S&P 500 is up 7.4%, the Nasdaq 100 is up 12.8%, gold is up 7.37%, crude oil is up 5.2%, the euro is up 1.69%, and 30-year Treasury bonds are down 1.67%. It is no mystery that as goes crude oil, so too goes the stock market. A look at these performance charts shows traders are shedding bonds and buying stocks.
In addition, gold is also experiencing a correction—or is it liquidation as investors have a risk-on appetite for stocks? Performance charts can help confirm seasonal tendencies as well as reveal if there is asset reallocation, or sector rotation, as analysts state.
As you can see, there is a link between these market relationships. Just look at the vertical line, which shows this market’s performance on February 29. Both precious metals and bonds fell sharply while crude oil and stocks rallied.

The billion-dollar question is, “Will E-mini S&P’s continue higher into the end of March?” Before I give my outlook based on my analysis, let me state this is one of the most confusing stock market conditions I have seen in quite a while.
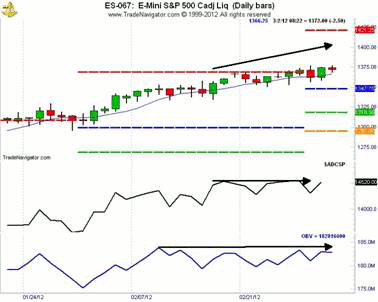
|pagebreak|Examining the chart in figure 3 below, we see bearish divergence in the S&P 500 Advance/Decline (A/D) line and in the on-balance volume indicator. Typically we see a mid-February break, as covered in the Commodity Traders Almanac (page 140), however, unlike the seasonal analysis for silver, which shows weakness, this event did not unfold for the stock market.
In effect, we had counter-seasonal strength combined with a huge cost increase in fossil fuel prices. We did see some sectors like transportation and small-caps, as represented by the Russell 2000 (TF) decline, but the indexes continued to close on their highs, demonstrating strength.

Meanwhile, technicians and traders all lined up looking for a correction that failed to materialize. Since the October lows, most stock indexes have gained well over 20%. The Dow is up 22%, the Nasdaq was up 27%, and the S&P 500 is up about 25%.
In fact, just looking at the year-to-date gains for the Nasdaq 100, 12% averages out to 6% per month. In my experience, I believe this performance will be unsustainable for a third month.
Here is my take on this: the old adage, “Tops take longer to form than bottoms” applies well here, and we need to see more participation in several sectors.
The market internals are pointing toward the fact that a correction is actually underway. Since February 20, when the March E-mini S&P’s closed at 1366.50, we have actually closed lower five times. The highest close was 1374.5 on March 1. The fact that the market has not seen a significant decline only feels like it has rallied over this period of time.
The 1370-1380 level in the S&P is presenting a wall of resistance that I am not sure we can break out of unless we see several changes in the fundamental picture. Increase in higher-end paying jobs, not temporary seasonal retail jobs. Housing values need to increase more than 1% year over year, and we absolutely need to wipe the slate on foreclosure home inventories, not to mention commercial real estate needs to improve as well. I would also like to see manufacturing jobs return to a higher percent or ratio to the employment figures. We also need a reduction in our deficit spending and lastly an ease in energy prices.
While the economy has improved, it has come with a cost: higher energy prices. This is not a positive situation, especially since we just entered a seasonally strong period. I could not imagine what the price level of crude could get to if tensions escalate in the Middle East.
I am not sure the market has priced this “black swan event” in, but I might add that owning put options for April expiration in the E-mini S&P’s and going long the oil sector would be the best play.
Trading Conclusion
If all remains calm in the Middle East and oil is up as an indication of a stronger global economy rather than unrest and supply shortages, then I am still siding with the seasonal aspect that the stock market will see a correction in March.
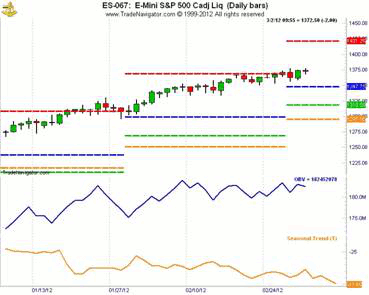
Therefore, let me reiterate: I do expect a correction to materialize, as I see profit taking to occur before the end of March. My downside targets are in the 1295 -1318 level. That equates to roughly a 4%-5% correction. In addition, that price level corresponds with the monthly Person’s Pivot support level at 1318.50 basis the March contract (see figure 4 below).

By John L. Person of PersonsPlanet.com


