Otherwise known as a double bottom, this chart pattern is one of the more common winning patterns that traders should recognize, writes Greg Capra of Pristine Capital Holdings, Inc.
In last night’s weekly coaching session with students, one of the concepts I reviewed with them is the different ways or places a W-bottom can form. The W-bottom pattern is a retest of a prior pivot low and reversal. The pattern typically results in a move higher, but the location where the pattern forms and/or what preceded it is a key piece of information that must be added. This information will greatly increase the reliability of the setup.
We teach students multiple technical concepts for trading and investing. These concepts individually are excellent tools; however, it’s the combination of these technical trading concepts in an organized method that creates excellent, high-odds opportunities. Here are some of the ways I covered using the W-bottom in last’s night coaching session for you review.
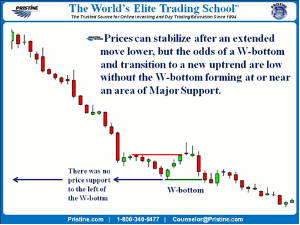
- A W-bottom within a downtrend and no price support to the left of current prices
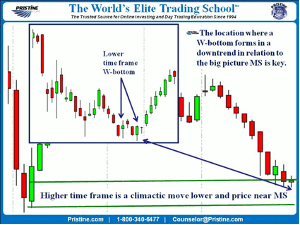
- A W-bottom in a shorter time frame with the longer having formed a climactic buy setup (CBS)
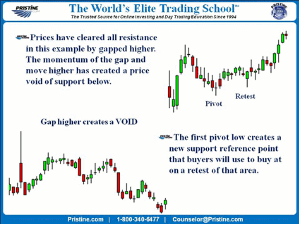
- A W-bottom after a strong momentum move higher
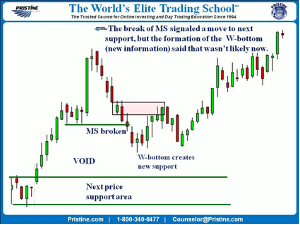
- A W-bottom after major support (MS) has been broken
I’ll review each of these with a chart example. In each example, I have excluded the price and time axis. The reason for this is the focus on the concept, not a specific time frame or price. All Pristine concepts are universal to all tradable instruments (stocks, futures, forex, etc.) and time frames. That being said, there is no right or wrong when it comes to what to trade or the time frame. It’s a choice. Of course, an understanding of the basics of what you are trading and multiple time frames is vitally important to successful trading and investing.
A W-Bottom Within a Downtrend and No Price Support to the Left of Current Prices
The first point to understand is that a W-bottom “creates new support.” For some reason, (for this lesson we don’t have to know why) buyers have stepped up and stopped prices from dropping further. As prices move up a bit, which forms a pivot low or sometimes called a swing low, prices then turn and continue to fall in anticipation of making new lows. In other words, lower highs and lower lows. However, at times, prices will stop and reverse at the first pivot low. This forms the W-bottom. While new support has been created and the possibility of prices moving to the upside has increased, this is the least reliable of the W-bottom scenarios.
A W-Bottom in a Shorter Time Frame with the Longer Having Formed a Climactic Buy Setup (CBS)
NEXT PAGE: 2 More W-Bottom Examples
|pagebreak|In this scenario, prices have been falling candle-after-candle like the proverbial falling knife and are now near or at an area of major support (MS). With MS to the left we know that buyers are going to show up and try to take control from the sellers. It’s now time to drop down to a lower time frame in anticipation of the W-bottom forming. Some of you may be thinking; why would I buy when prices are in a downtrend, even if they are retesting a prior pivot low? The reason is that downtrends or what we refer to as a Stage 4 in the cycle of prices often bottom and become a Stage 1 in the cycle after reaching MS on a climactic drop. With this scenario, the W-bottom setup is an excellent trading opportunity.
A W-Bottom After a Strong Momentum Move Higher
In this scenario, prices have moved up with strong momentum. When this happens, the speed at which prices have moved up leaves little-to-no-price support below. There is now a Pristine Price Void (PPV) below. Without price support to buy at on the pullback, there is no clear reference point to place a bid. Without price support, the odds of a price wiggle or shakeout before a continued move up is likely. Pristine students will use our money bar setup to enter when it happens. If not, the W-bottom will be the setup to enter on.
In the example shown, prices made a slightly higher low, but it is not uncommon for the right side of the W to make a lower low than the first pivot low. This is okay and can make for an even greater odds setup because of the shock effect on the earlier buyers’ stops being taking out.
Pristine Tip: Price patterns are a reflection of other traders’ prior actions, beliefs, and likely future actions.
A W-Bottom When Major Support Has Been Broken
When major support has been broken in an uptrend, that uptrend has been violated, so the uptrend no longer exists. The series of higher highs and higher lows being broken, and prices moving under MS suggest a move lower to the next price support level. Now as we know, what is suggested on the charts does not always happen. For that reason, part of our method must include an objective way of combining new information (price patterns) into the past that created our bias. Without that, we as traders, can get stuck in the past and mentally fight against the change that is happening. In part, this is what causes the need to be right and not adhering to a predetermined stop-loss.
With prices having moved under MS and the next level of support lower, a W-bottom suggests that prices are not going to move to that lower level. Rather, it is telling us that buyers have taken control, created new support, and are going to attempt a move to the old highs, and very possibly beyond those old highs. The reason I said beyond those old highs is because a move below MS in the time frame being viewed does not necessarily violate the uptrend in the higher time-frame. For example, MS can be violated in the daily time-frame and the uptrend broken, but the weekly uptrend still is intact. Under this scenario, prices often do move to new highs within that trend.
As with all price patterns, the understanding of candlestick analysis is essential. The use of bar-by-bar analysis, as well as the addition of other concepts will increase the accuracy of your trading or investing decisions.
By Greg Capra, President & CEO, Pristine Capital Holdings, Inc.


