As a trader begins his journey learning to trade, the process of creating a foundational understanding of the markets becomes very important, writes Don Dawson of Online Trading Academy.
From the moment a trader begins to learn how to read charts, understand the fundamentals that drive these markets, and the market mechanics, he is always on the lookout for something that will help increase his win ratio. This is called finding your edge. Since a large percentage of traders use charts and see the same supply/demand levels, we must find ways to enhance certain levels to give us this edge over other traders.
I would like to show you this concept of contango and inverted futures markets and how it helps provide this edge.
Commodity futures markets are dominated by commercial traders on a daily basis. These commercial traders are market participants that use the commodity in their daily business. After all, the reason we even have commodity markets is because of the commercial traders. They must be in the market each day hedging (limiting price fluctuation risk so they can lock in a profit margin for their business). This group of traders conducts on average 65% of the daily volume in the futures markets each day. Sometimes people refer to the large traders (large speculators who trade over a certain number of futures contracts and have to report these to the exchanges) as smart money. If the truth were to be known, the smart money is actually the commercials in the markets. They know every fundamental reason for when and why a price should change. Commercials are very well capitalized with lines of credit from banks to back their trading decisions.
Commodity markets are built on supply and demand. When there is excessive demand for a commodity, prices will rise. When there is excessive supply of a commodity, prices will fall. At any given time, there is only so much supply of any given commodity and once demand strips this supply, it has to be replenished; this will take time. There is always fear in the commercial trading arena that when a commodity is needed for delivery or processing that there may be less supply than anticipated causing commercials to pay up as demand outstrips supply.
I tell you this information because if you understand who needs these commodities you will understand why there are times during the trading year that prices can be structured to tell us who is controlling the market. There can be excessive demand and the supply is tight causing commercials to pay up or supply is plentiful and the commercials are storing the commodity.
Figure 1 illustrates when studying futures market prices you can see one of two scenarios:
Normal Market or Contango – Prices are less expensive in the near months than the distant months
Inverted Market or Backwardation – Prices are more expensive in the near months than the distant months
NEXT PAGE: Price Structure Provides Clues
|pagebreak|Figure 1 shows us the wheat and soybean markets with their corresponding closing prices. Notice how with the wheat prices each month’s prices are getting a little higher. This is referred to as a normal market. The reason for each month’s prices being higher is that commercial traders are buying the actual commodity in the cash market and physically storing it in grain elevators until the delivery month arrives. This is typically done when there is ample supply and less demand for a particular commodity. While storing these commodities for future delivery, the commercials will encounter carrying charges. The carrying charges are storage (building rent/mortgage), interest (interest paid on credit lines while storing) and insurance (building and inventory). There are other smaller fees, but these three are the primary ones. Adding up all these costs and dividing by 12 will show how much it cost to store the commodity each month. This is reflected in the ascending price order. During this time the particular commodity could be in a down trend or up trend.
Months Traded |
Normal Market Wheat |
Months Traded |
Inverted Market Soybeans |
July |
680’0 |
July |
14.78’2 |
September |
688’4 |
August |
13.90’2 |
December |
703’4 |
September |
12.88’0 |
March |
722’6 |
November |
12.20’6 |
Figure 1
Figure 1 also shows us the soybean market. Notice how July is trading for 14.78’2 and each succeeding month is priced less than July. This is referred to as an inverted market. In London they call it backwardation. An inverted market sends market participants a very important signal and should be heeded. When you see a market in this inverted formation it is screaming at you “a full blown bull market is underway and do not step in front of it!”
Markets will become inverted when commercials perceive there will be or is a major supply shortage in the future of a particular commodity. Remember in a normal market how the commercials had the luxury of time on their hands and they could buy the commodity and sit on it until delivery? Well, an inverted market is telling you that nobody is willing to store the commodity and everybody wants it right now. All the demand is right now and it outstrips the current supply. As soon as the commercials get the commodities in their hands, it is out the door and to a processor or end user.
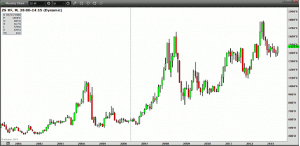
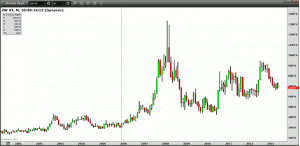
Figure 2 and 3 will show the wheat and soybean markets. Notice how Figure 2 wheat is in a large sideways market. The price structure in Figure 1 shows there is no immediate demand for wheat. Producers are storing wheat in grain elevators waiting for higher prices before they sell their crops.
Figure 3 shows a monthly chart of soybeans. Notice how we have had a nice uptrend with higher highs and higher lows for a long period of time. The price structure from Figure 1 shows there is immediate demand for soybeans and most producers are selling their crop as soon as they get it.
By observing the price structure of physically delivered commodities, a trader can get a sense of whether they can anticipate a bull market as in Figure 2 soybeans or a normal sideways market as we see in the Figure 3 wheat market.
By Don Dawson, Instructor, Online Trading Academy


