
Sponsored Content - TG Watkins, director of stocks at Simpler Trading, goes into detail on the best chart patterns you should know and use with the Moxie Indicator.
As an active trader, I’m always searching for the next movement or trend in price that leads me to potential gains. Chart patterns are the bread-and-butter of trading, and traders have go-to patterns they rely on in their trading strategy.
Some of the most important chart patterns for my trading style include reversals and continuation patterns. Let’s talk about what they are and how I use them.
What are Reversals and Continuations?
First let's start with the basics and define these chart patterns.
A reversal pattern is a change in the direction of the stock price. For example, if the stock is up, its reversal pattern will be a down trend; if a stock is down, its reversal pattern will be an uptrend.
A continuation pattern indicates an ongoing price trend in the same direction. It tells the trader that the trade is worth consideration…essentially, if the pattern will continue.
Let’s talk about two specific chart patterns—one reversal, one continuation—that can increase your success as a trader.
The “Elf Shoe” Method: A Reversal Pattern
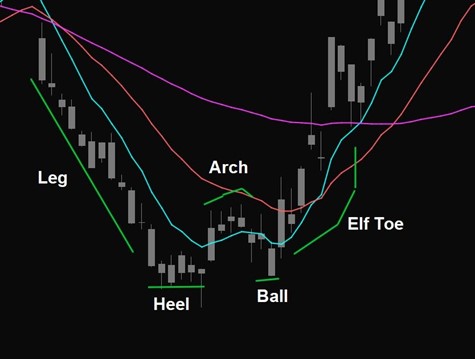
The “elf shoe” is a reversal pattern also known as the double bottom. This is where the chart pattern indicates a declining stock, and the trader is alerted to start testing how low the stock will go. If the stock doesn’t go any lower, the trader will want to keep a watchful eye on that stock. As the stock begins to rise, that’s when the trader will want to strike and catch the reversal on the way up.
As you can see in the chart example below, when using the Moxie Indicator™ to reveal this pattern, it will form an image that looks like an elf shoe (indicated in green on the chart). This pattern tracks precise price movement and can help you understand what to look for when trading.
As an aside, Moxie is a premium indicator that I developed to signal entries and exits with precision, and it’s compatible for use with computer trading platform thinkorswim®, StockCharts.com, and soon, TradingView. It’s a key part of my personal trading strategy and trading plan, and therefore, part of the chart patterns I follow daily.
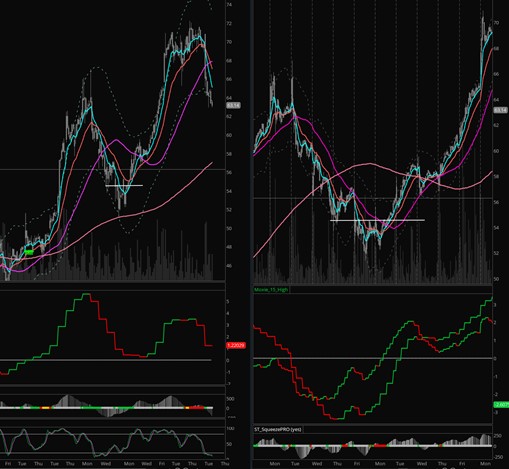
A couple of things to recognize when following the double bottom, or elf shoe, pattern on charts. First, it doesn’t have to be a true double bottom. Also, it’s important to retest lows to help verify the pattern.
For example, your pattern could be a shallow double bottom or a deep double bottom. A shallow double bottom is where the second low indicator on the chart is higher than the low of the stock price. A deep double bottom is where the second indicator is lower than the original low of the stock. The shallow and deep double bottom patterns allow traders flexibility within certain stocks. They also help traders track moves and make trades within their comfort zone.
The “Trampoline” Move: A Continuation Pattern
The “trampoline” move is a continuation pattern revealed when using the Moxie Indicator. The tool signals the trader, indicating whether momentum for a stock is positive or not (chart example below). If the indicator is telling the trader that the stock is positive, that positivity will be sustained until the indicator says otherwise.
Now, there are times when the indicator and the moving average of price will not be in sync with each other; they may, in fact, seem contradictory. For instance, it’s common for the Moxie Indicator to show a positive continuation even though the stock has dipped below a moving average.
If that happens it’s important to not panic. In fact, have confidence and understand that if the dip is viable, the Moxie Indicator will still show that the stock and momentum are positive. The “trampoline” is getting ready to release energy and continue higher. It’s important to buy on these good dips and get a lot of energy out of the stock to capitalize on potential gains.
Conclusion—Pattern Your Trading Success
By far, the best reversal and continuation patterns I’ve found are the elf shoe method and the trampoline move. Observing these patterns combined with the signals from the Moxie Indicator, I can clearly see the strength of a price trend and make more successful trading decisions.
If you’d like information and education on charting and trading strategies, be sure to visit us at SimplerTrading.com.


