
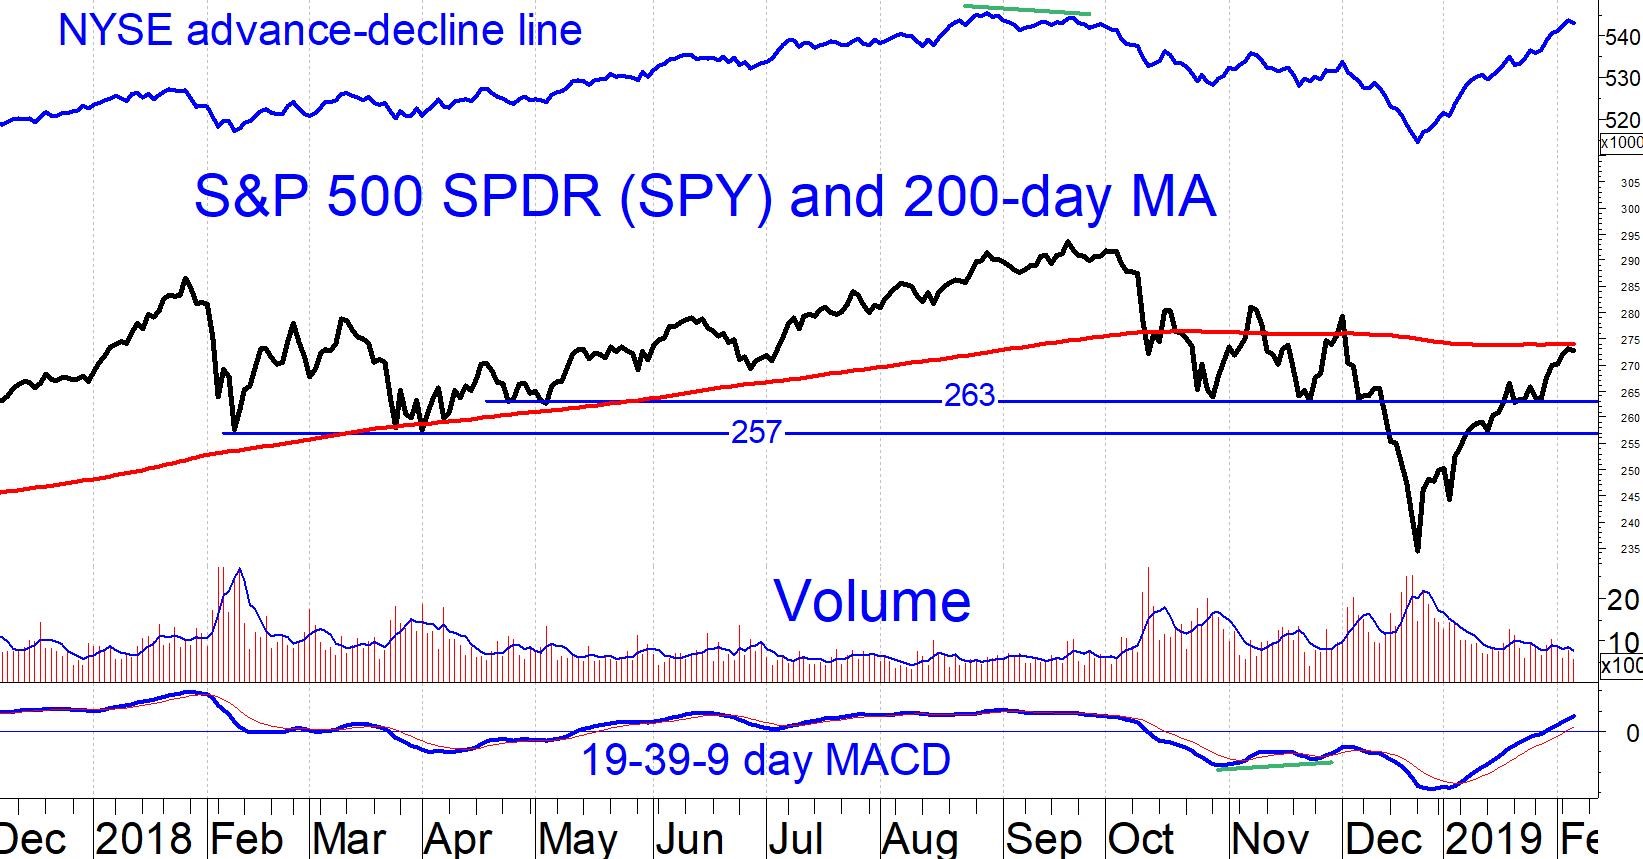
If yesterday’s decline continues, SPY should find support in the 257-263 area, write Marvin Appel, who will be speaking at the TradersEXPO New York on March 12.
The S&P 500 SPDR (SPY) pulled back sharply on Feb. 7 after almost touching its 200-day moving average (See chart below). Historically, this type of action following a rapid rally has indicated weakness before stocks ultimate make new highs. If yesterday’s decline continues, SPY should find support in the 257-263 area.
Our U.S. equity timing model is positive, suggesting that the stock market will rise over the next several months. However, after the big gains that have already occurred in the last few weeks, the remaining upside potential is modest while volatility is likely to remain high. In this environment, high yield bond fund trading and covered call writing appear to be attractive. If stocks are destined to rise then these strategies should also be profitable, but if stocks are destined to fall then these strategies could hold up better. If you have money in cash that you are looking to put to work, adding a covered call position to SPY when VIX reaches 19 is a historically good way to bottom fish.
In the last issue I noted that emerging markets had outperformed U.S. equities in the fourth quarter of 2018 and appeared poised to trigger one of our asset allocation models to switch from favoring U.S. equities to favoring emerging markets through the iShares MSCI Emerging Markets ETF (EEM). That model updates monthly, and as of Jan. 31, 2019 still favors U.S. equities. EEM will have to outperform SPY by 0.7% in February to trigger the signal to switch to emerging markets.
Developed-country foreign stocks, as represented by the iShares MSCI EAFE Index ETF (EFA) have not been as strong as emerging markets in the past four months. The chart below shows that, like SPY, EFA has rallied straight up from the Dec. 24 lows without any hint of a retest. MACD is relatively overbought, at its highest level since the market peak in January 2018 (although EFA is down 14% from that high). Unlike EEM, which has been stronger than SPY, EFA has been merely keeping pace, as evidenced by the sideways movement in the EFA/SPY ratio since September. The EEM/SPY ratio is currently above its 200-day moving average, but the EFA/SPY ratio in the chart below is still below its 200-day average.
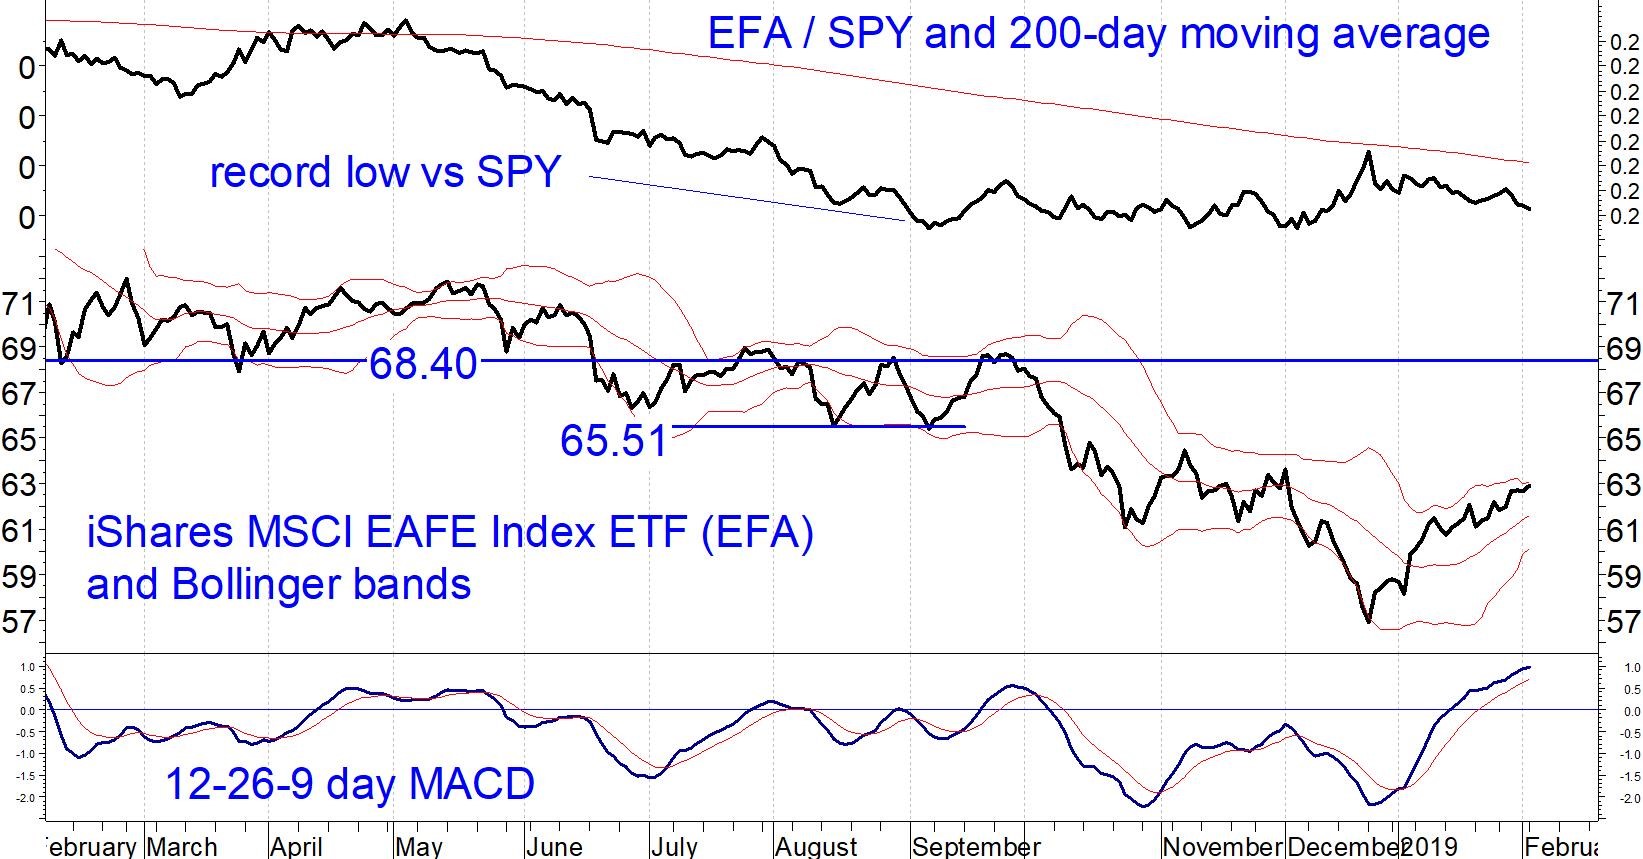
The bottom line is EEM is technically stronger than EFA on a long-term basis.
However, on a tactical basis there may still be an opportunity in EFA. We are following our foreign equity timing model, which has historically delivered better risk-adjusted performance for EFA than for EEM. When that model gives a buy signal, readers will be advised to buy EFA.


