
The QuantCycle Oscillator is showing unleaded gas, lean hogs and the German Dax all overbought, notes John Rawlins.
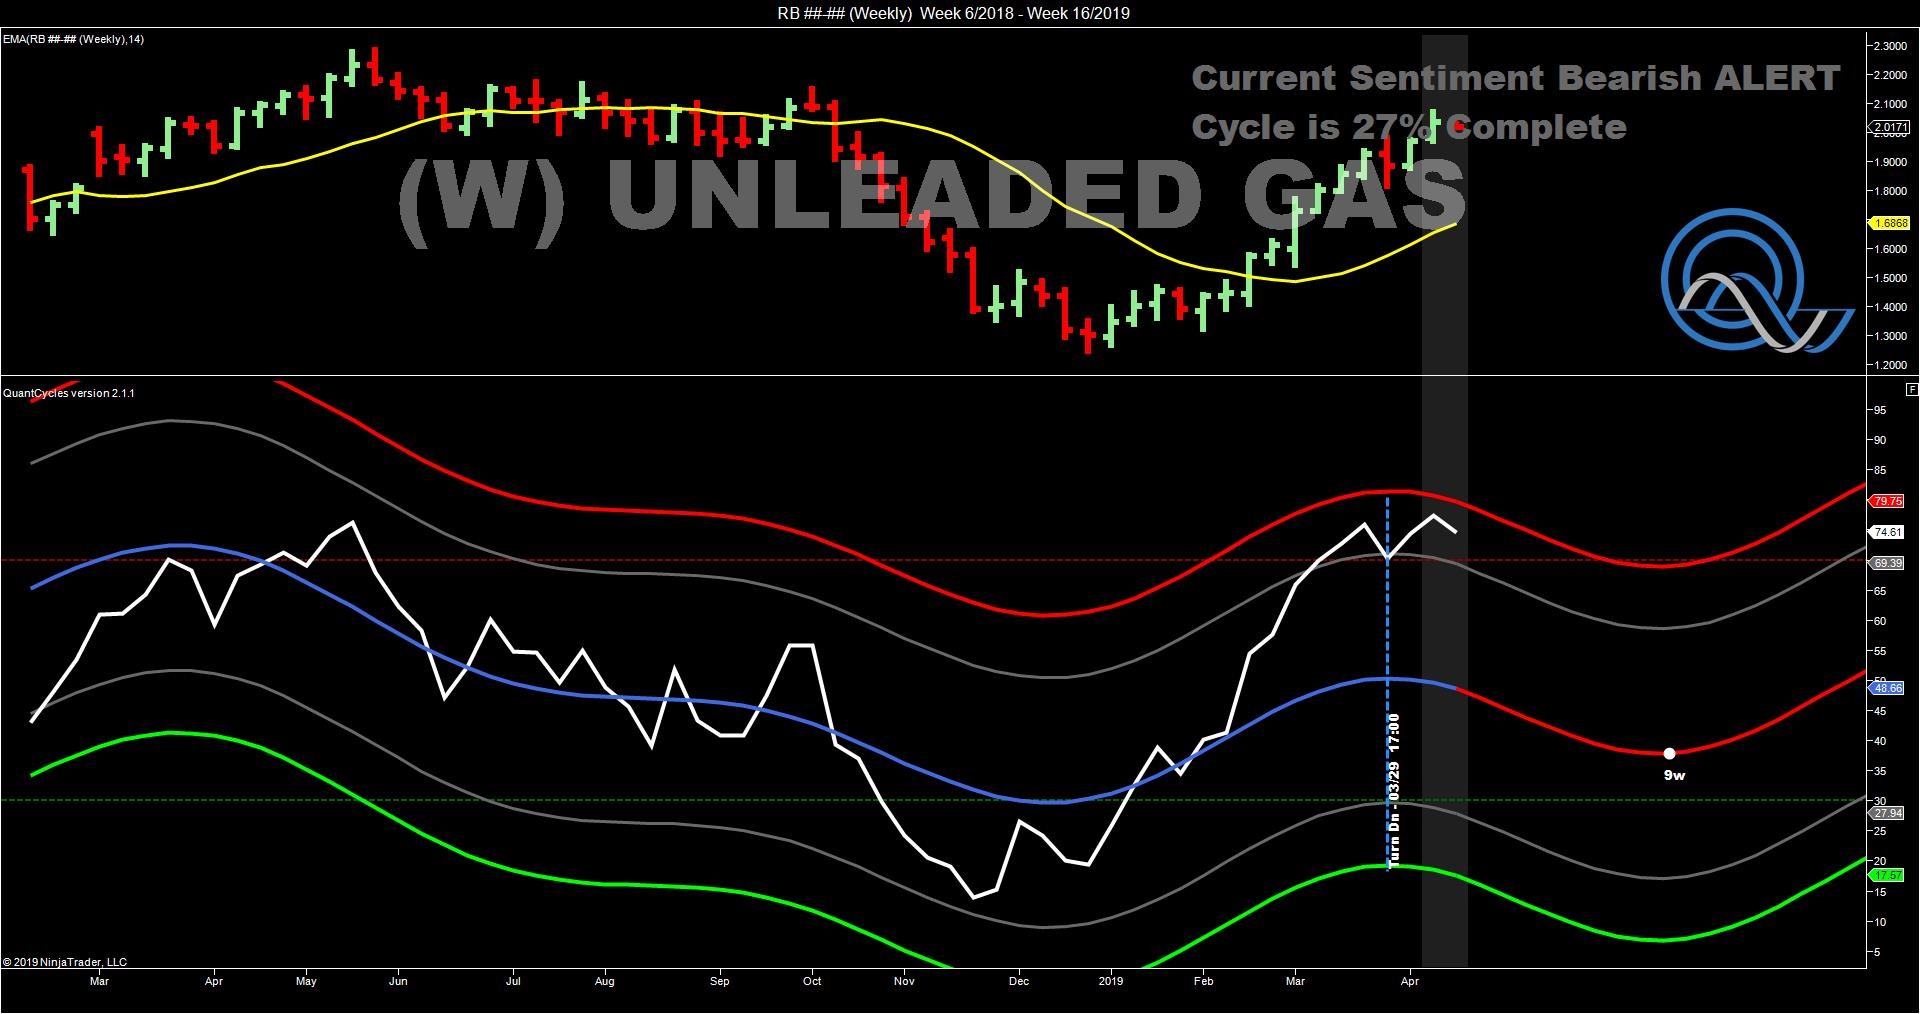
Last week we pointed out how the entire energy complex had moved into long-term overbought or oversold territory, though the unleaded gasoline contract appeared to be the only market where the long- and short-term oscillators lined up for a sell signal.
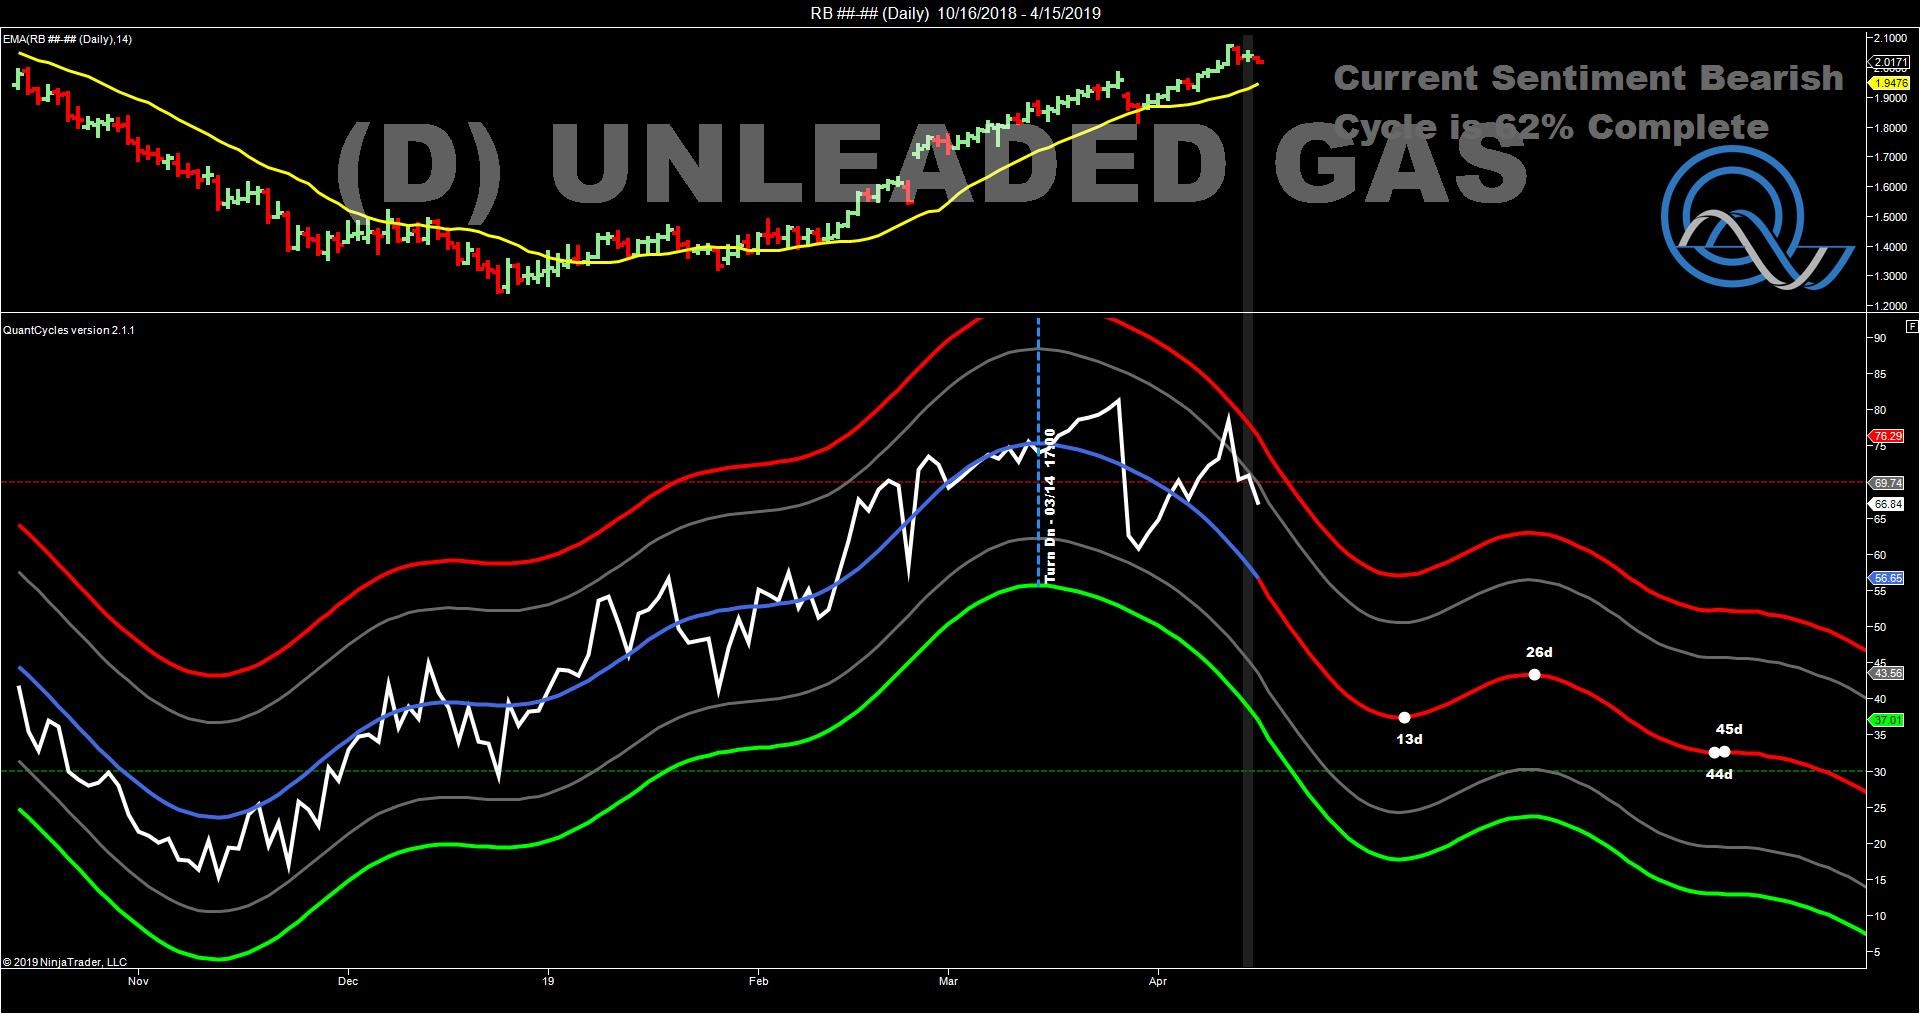
Unleaded gas did begin to fall and it is still primed for a larger sell off.
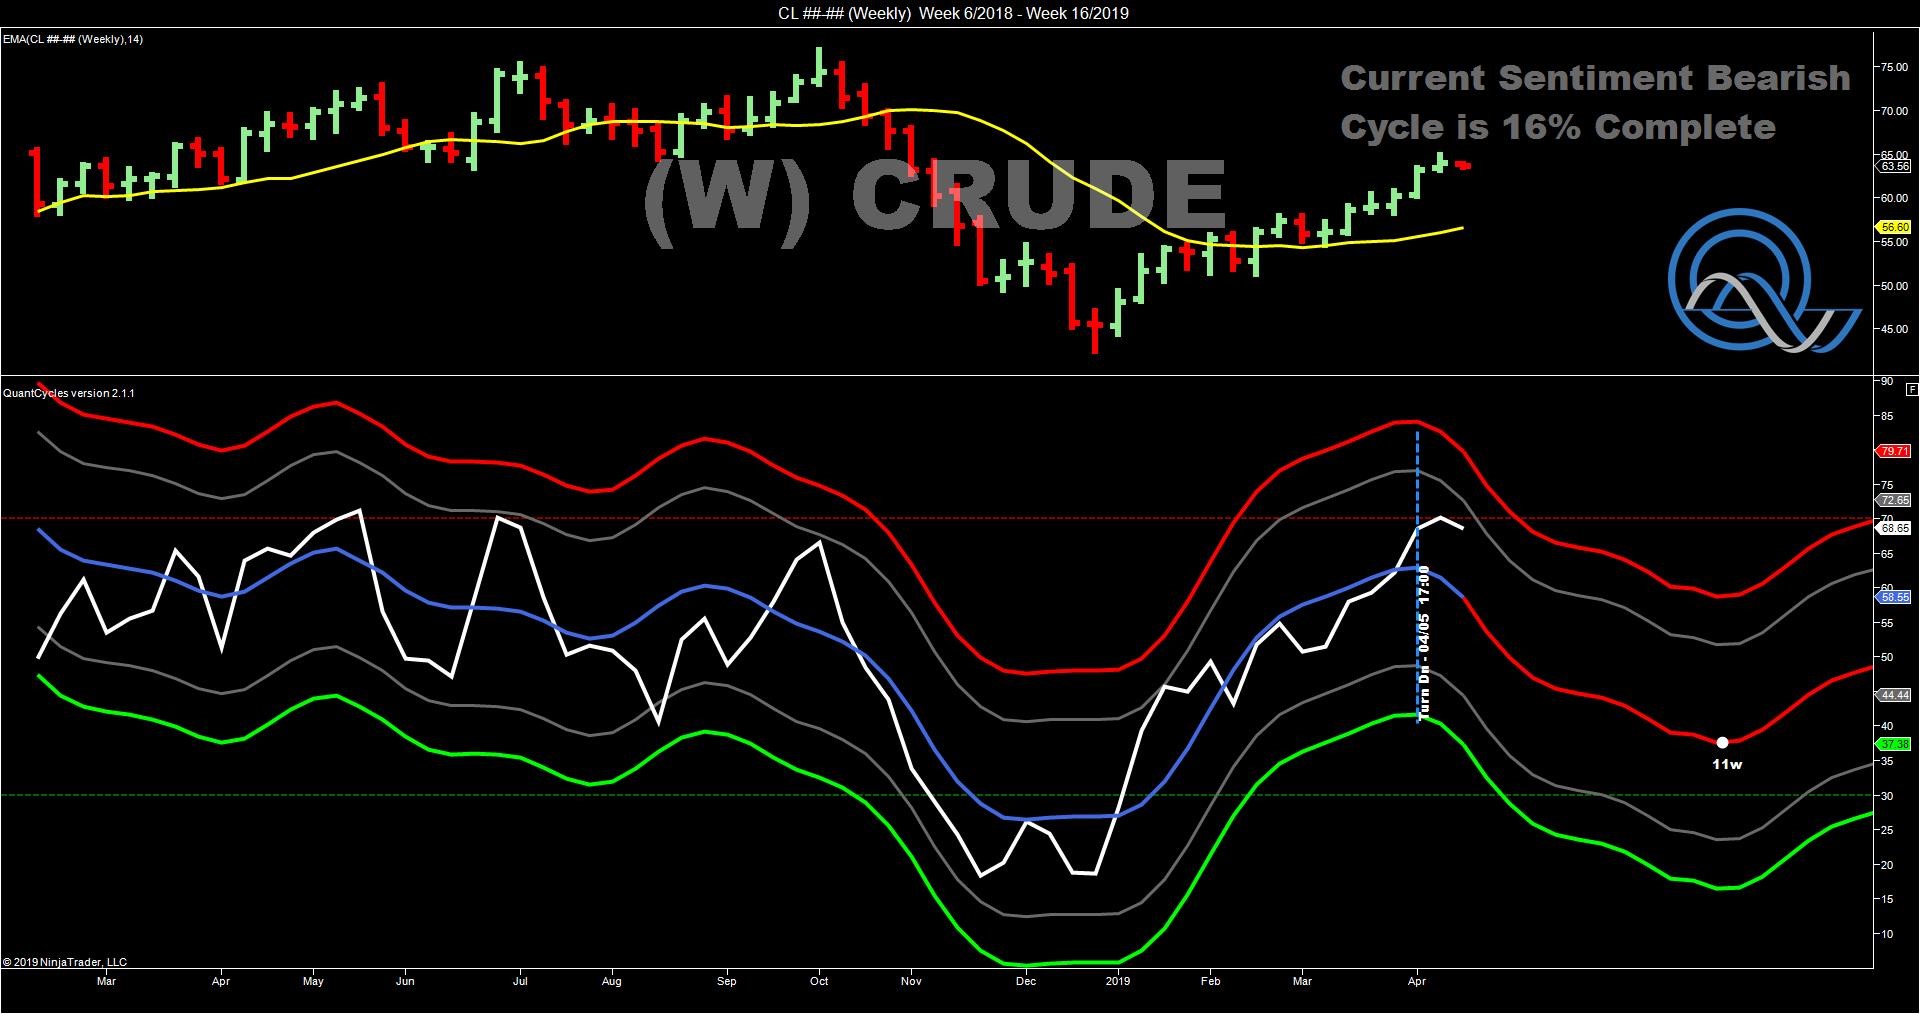
Crude also remains overbought on the long-term chart, but that has not been significantly confirmed on the shorter-term chart.

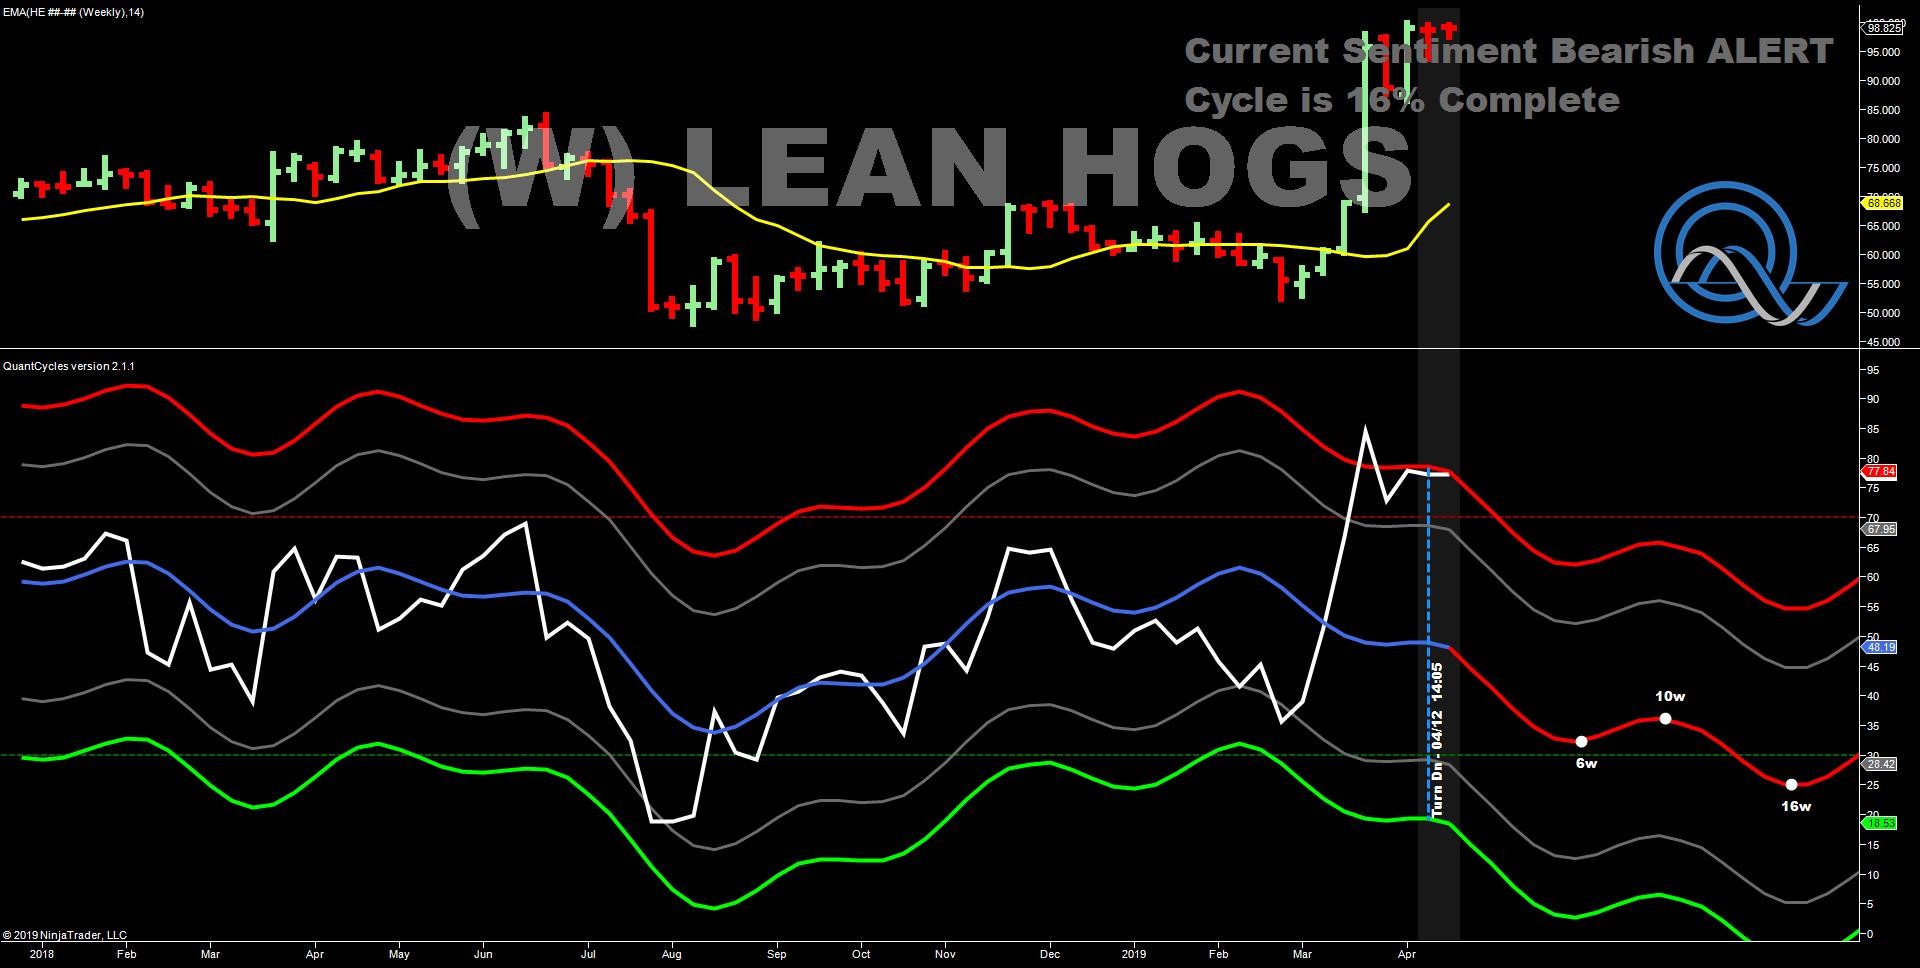
Hog Wild
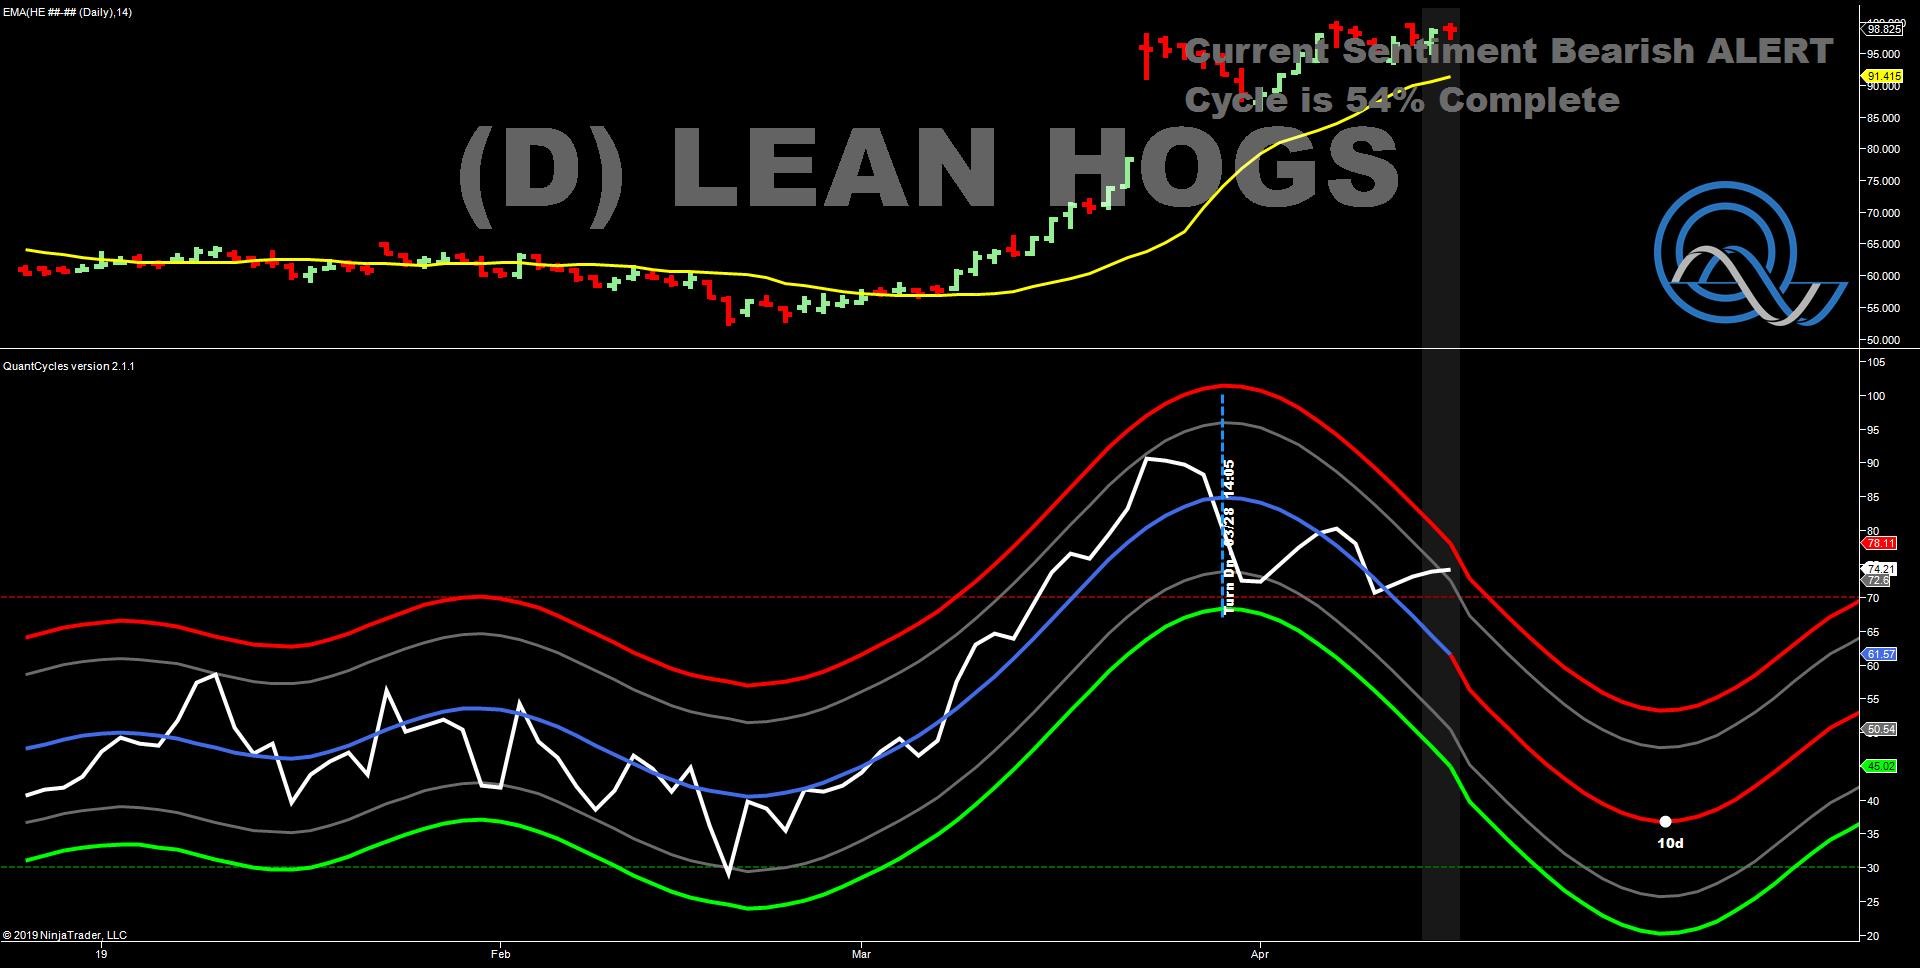
Two months ago the QuantCycle Oscillator correctly picked the upward reversal in lean hogs.
That moved has been so strong and lean hogs have maintained its gains that it has moved into overbought territory with the QuantCycles Oscillator pointing lower on both the daily and weekly charts.
Hogs are now a strong sell.
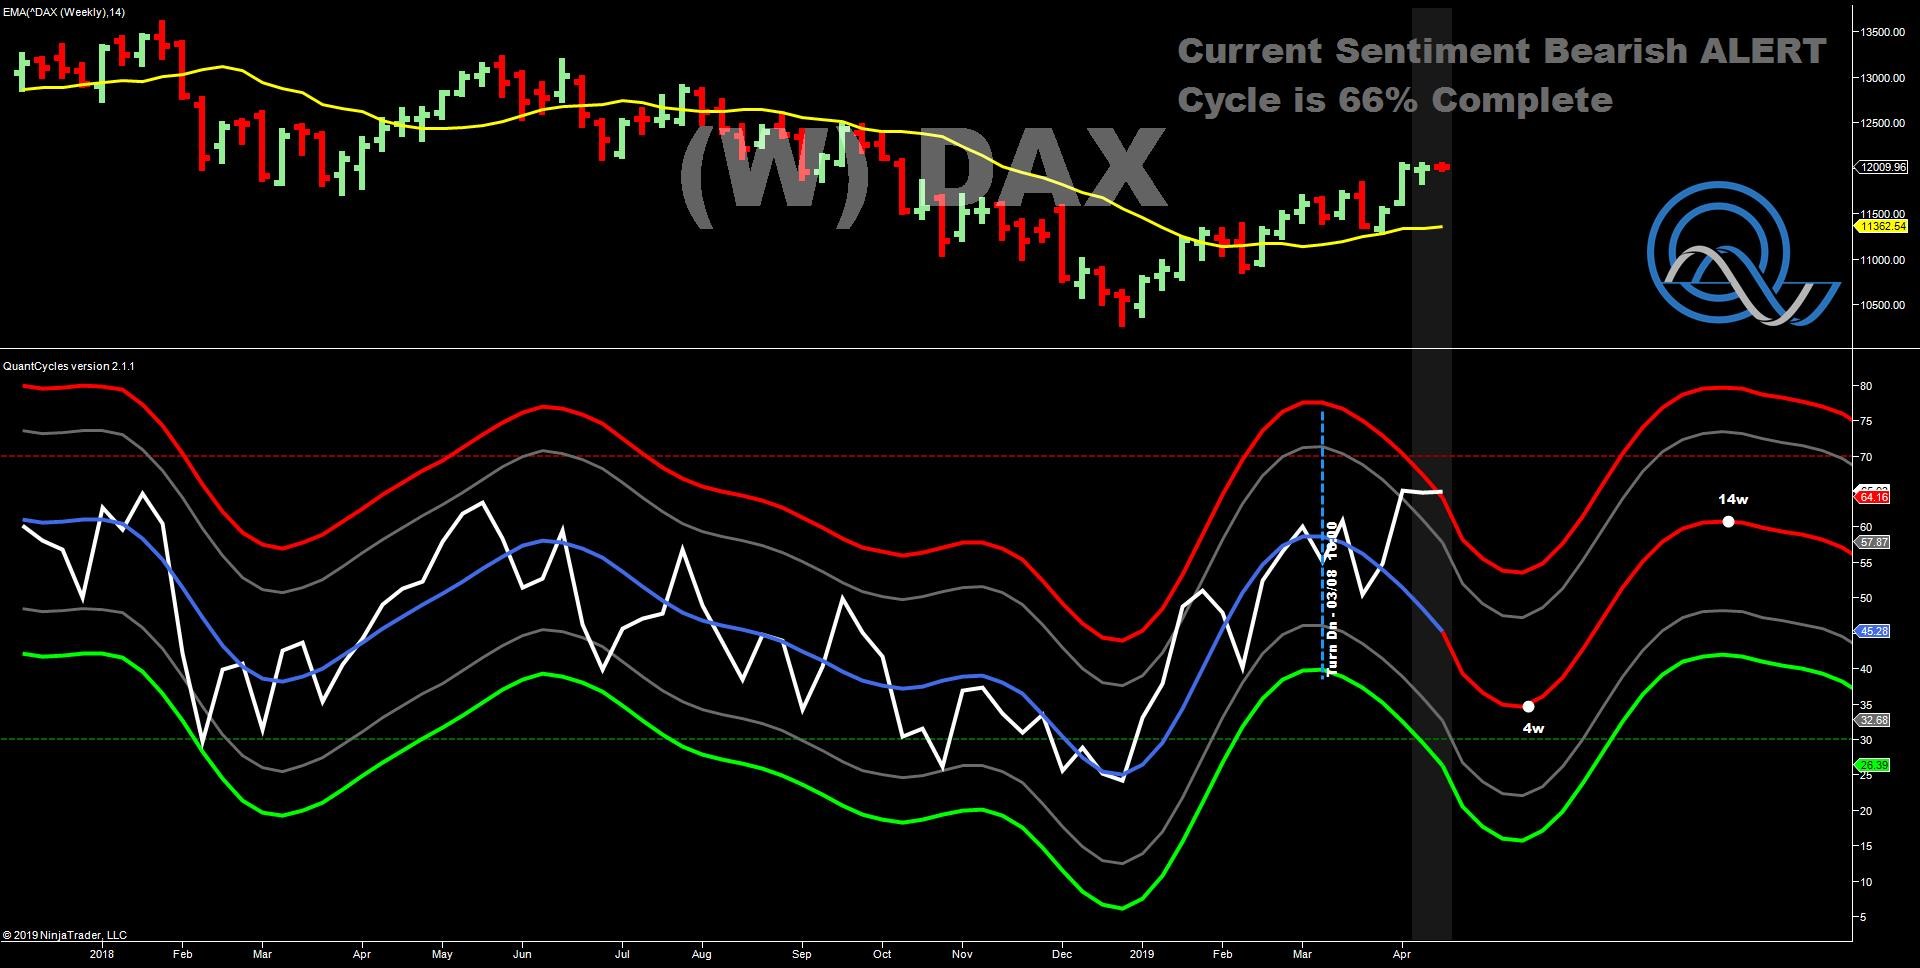
Dax to You
With a lot of discussion regarding weak economic data coming out of Europe, and a potential recessions in Germany, the EU’s largest economy, it is a good time to look at the Germany’s benchmark Dax Stock index.
It has moved into long-term overbought territory while the QuantCycle Oscillator is showing a sharp downturn persisting for four weeks. This is a strong sell signal with the chance for a major bullish reversal later this spring.
John Rawlins described the value of the QuantCycle Oscillator recently at The Orlando MoneyShow.
The QuantCycle indicator is a technical tool that employs proprietary statistical techniques and complex algorithms to filter multiple cycles from historical data, combines them to obtain cyclical information from price data and then gives a graphical representation of their predictive behavior (center line forecast). Other proprietary frequency techniques are then employed to obtain the cycles embedded in the prices. The upper and lower bands of the oscillator represent a two-standard deviation move from the predictive price band and are indicative of extreme overbought/oversold conditions.


