
After correctly predicting the gold rally, the QuantCycles Oscillator expects gold to continue higher after a minor correction, notes John Rawlins.
A little more than two weeks ago (May 20) we presented the bullish QuantCycles outlook on gold.
The outlook proved prescient, especially over the last couple of days as gold futures soared $75 in a week’s time.
It is a good time to take a look at the current QuantCycles reading on gold in both the near-term and long-term.
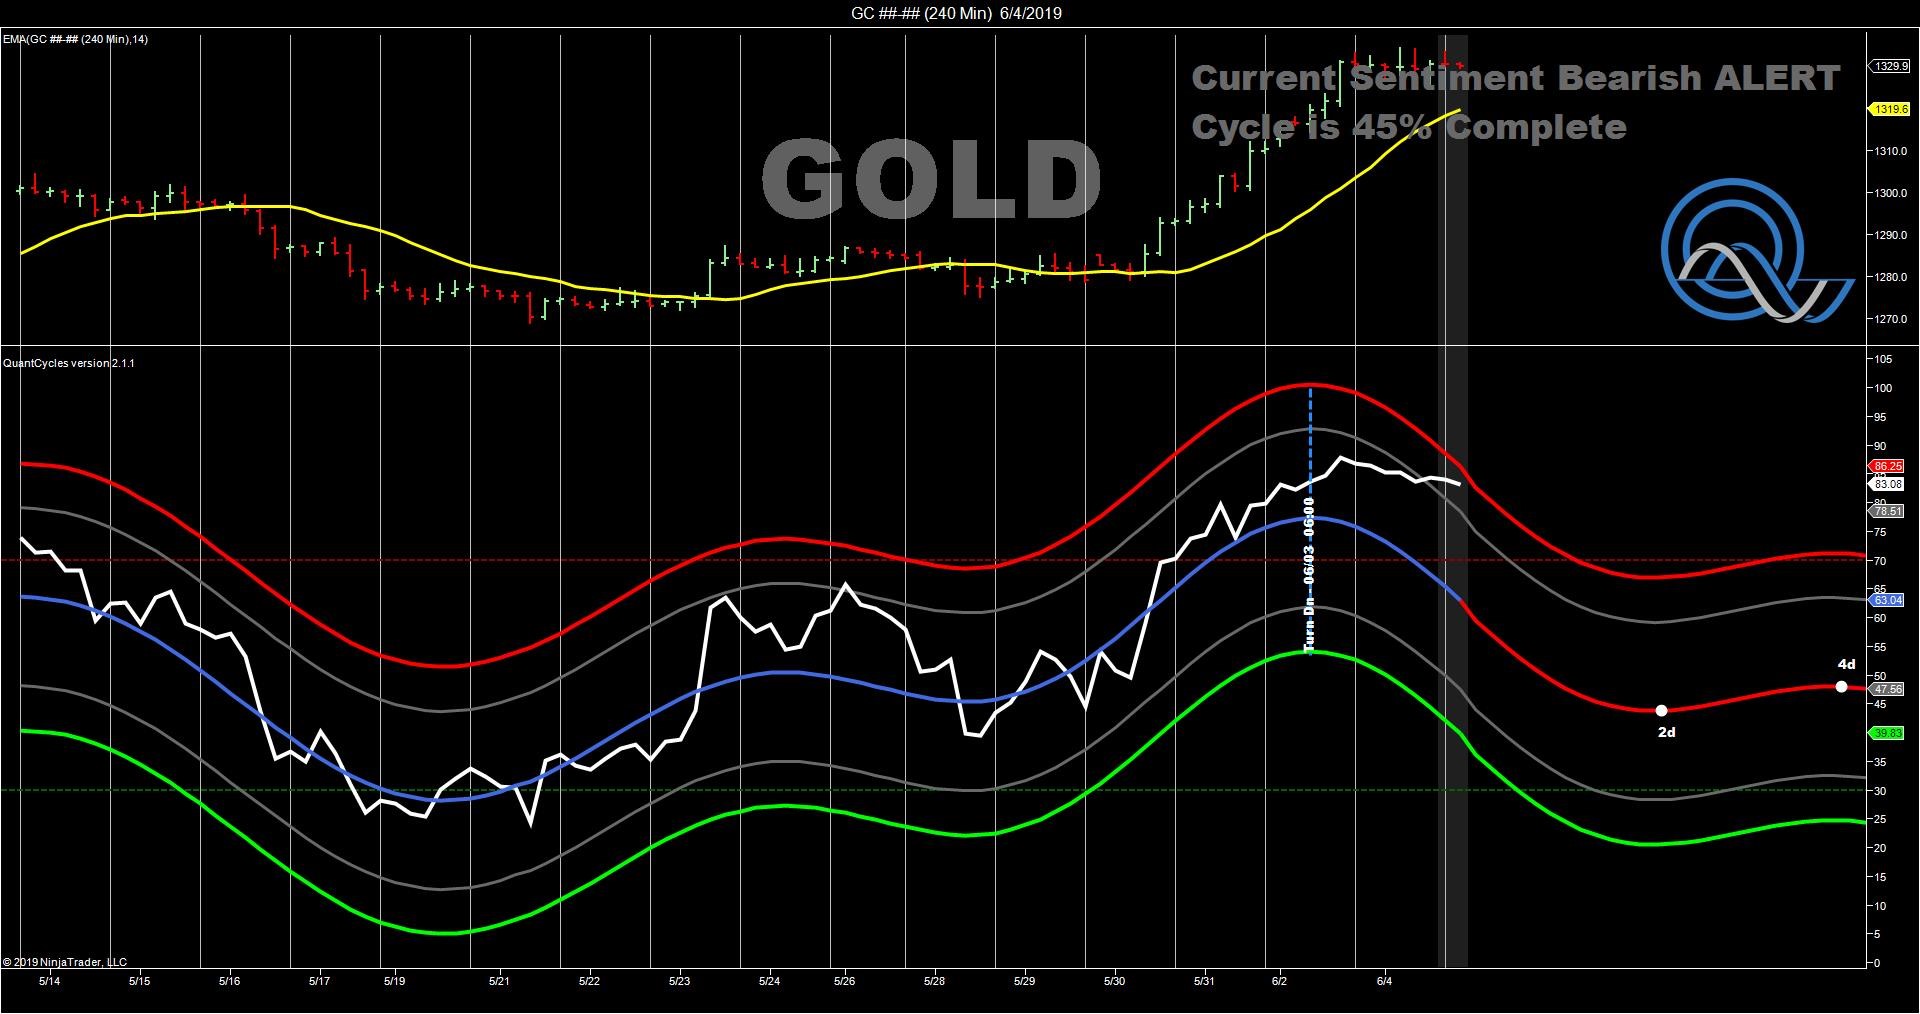
In the near-term (four-hour oscillator), gold is clearly overbought and due for a correction (which already has begun today as gold is off its daily high by $15). Gold had turned lower of the four-chart chart earlier in the week and is near extreme overbought territory, suggesting a correction over the next couple of days (see chart).
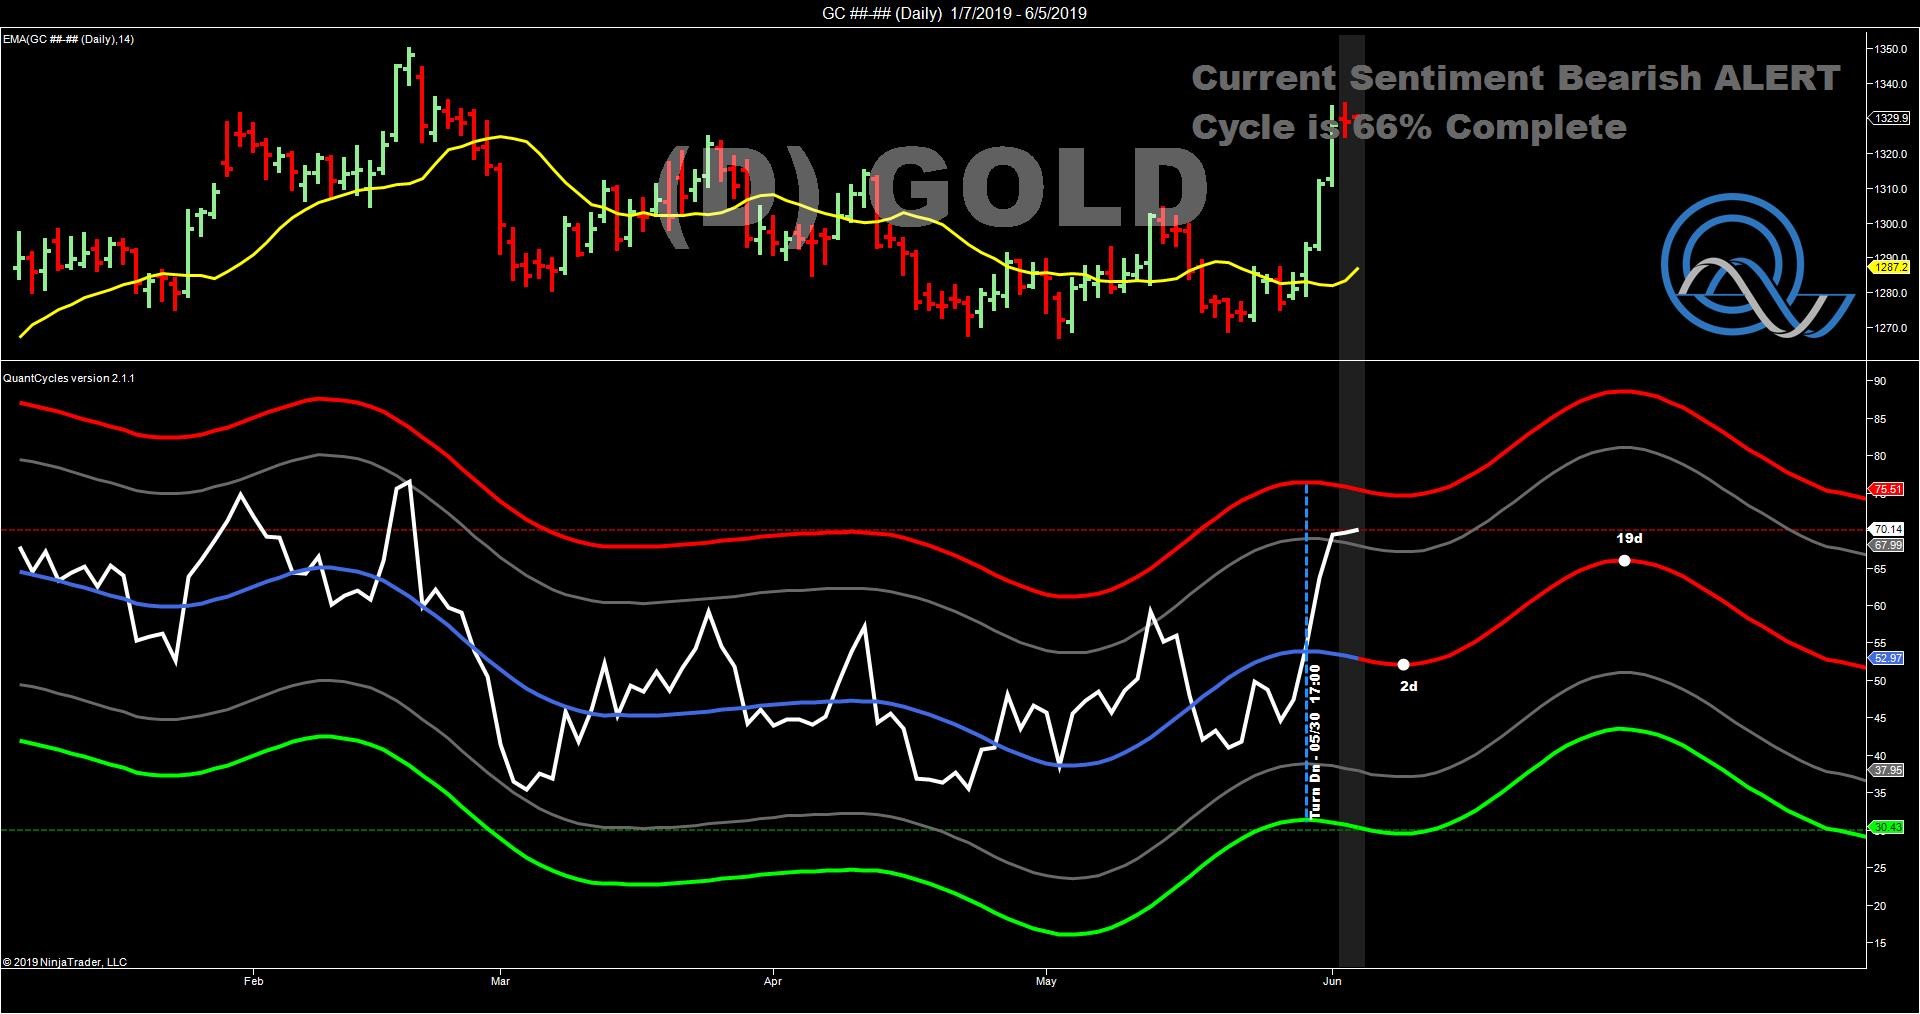
The daily chart confirms the overbought status and even shows a narrow corrective window of a couple of days. However, the main thrust of the daily chart suggests that the current rally has some legs and can remain intact—albeit with a minor corrective move—for close to three weeks (see chart).
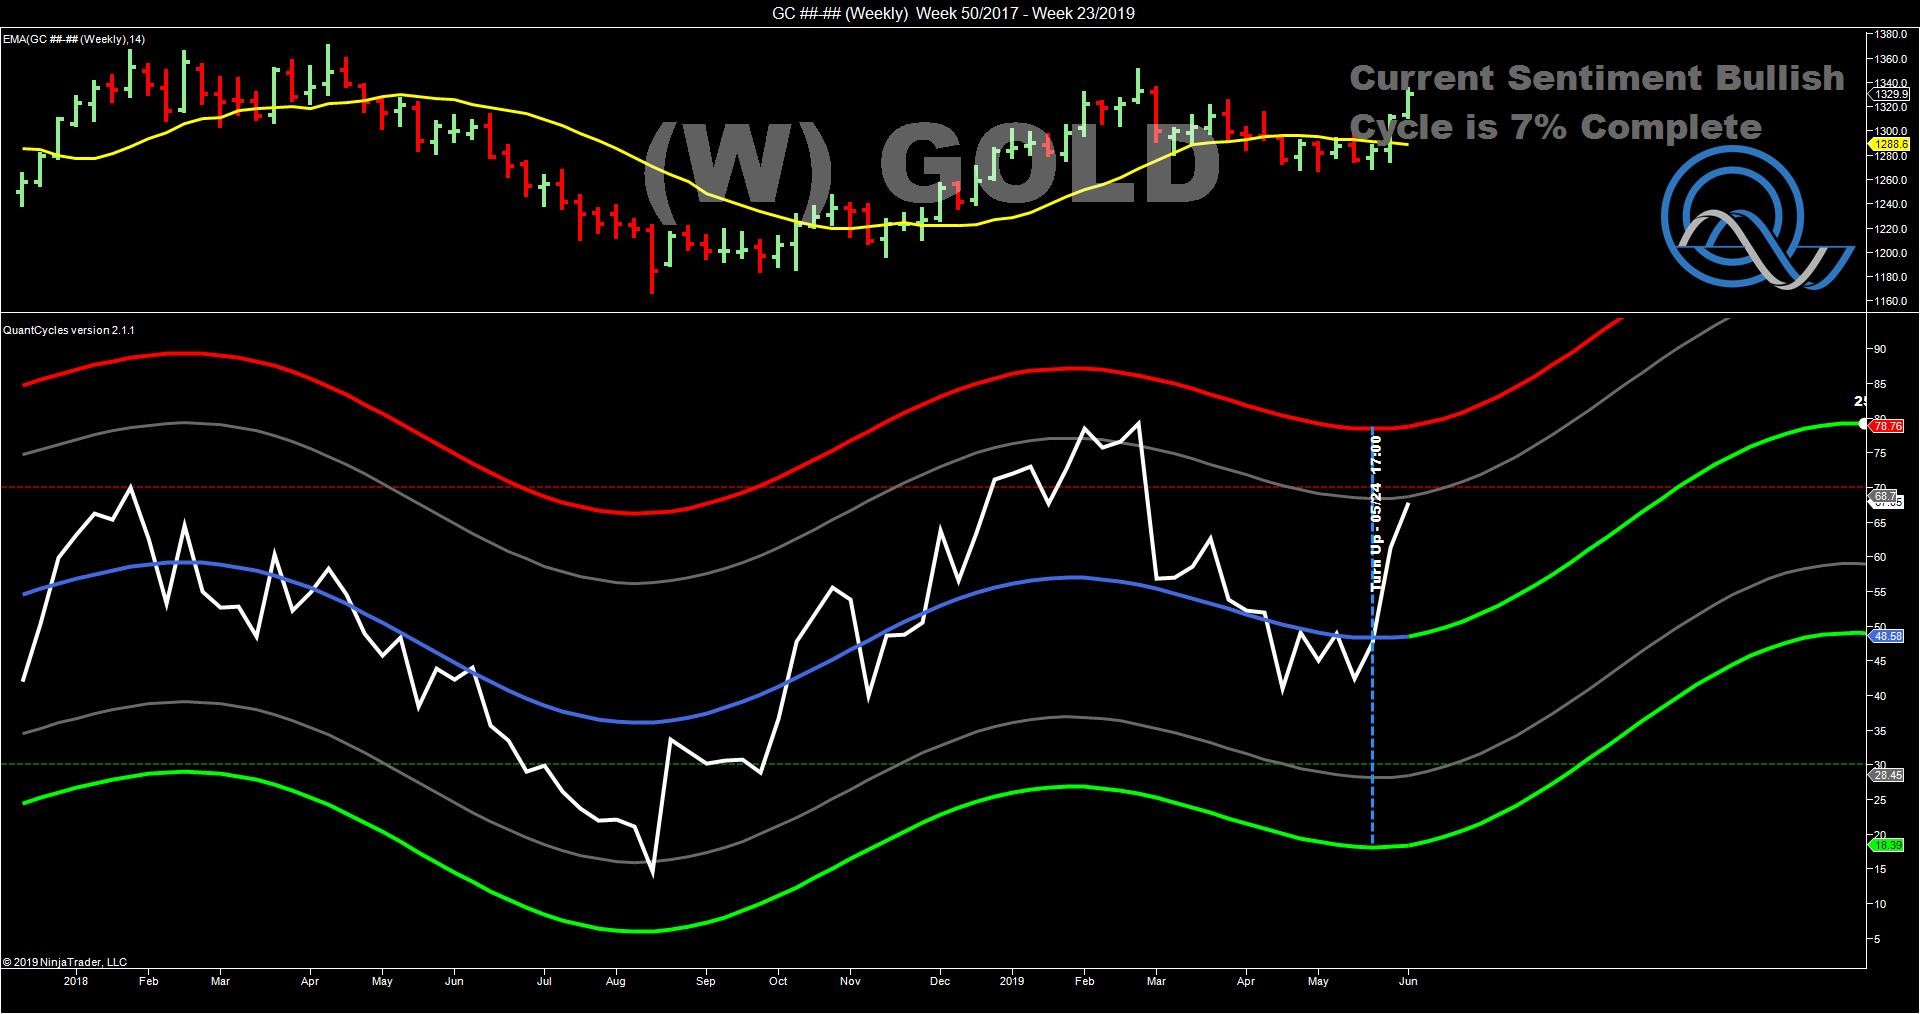
Looking out longer-term, gold remains in a strong bullish trend. The weekly oscillator, while somewhat overbought, has the bull move in gold lasting for the rest of 2019.
What to do?
Short-term traders may what to take partial profits or hedge some of their longs. If you missed this move, you may want to wait for gold to correct further before getting back in, but the move in gold appears to still have some legs.
John Rawlins described the value of the QuantCycles Oscillator recently at The Orlando MoneyShow.
The QuantCycles indicator is a technical tool that employs proprietary statistical techniques and complex algorithms to filter multiple cycles from historical data, combines them to obtain cyclical information from price data and then gives a graphical representation of their predictive behavior (center line forecast). Other proprietary frequency techniques are then employed to obtain the cycles embedded in the prices. The upper and lower bands of the oscillator represent a two-standard deviation move from the predictive price band and are indicative of extreme overbought/oversold conditions.


