
Here are the predicted ranges in major markets for next week by Trevor Smith.
Crude oil is resisting lower lows, as illustrated by yesterday’s bullish-engulfing candlestick pattern (see chart below). While stronger volume around that candlestick make a stronger signal, I do see enough of a tail on that candle to conclude that markets rejected the lows with force in their higher close.
The ProShares Ultra Bloomberg Crude Oil ETF (UCO) shows a weekly-chart candlestick that is a red hammer low, indicating a possible buy signal when price reaches down to the halfway point of the hammer’s tail. Although sellers are present it is still a buy signal. Therefore, traders need to be long the crude oil, entering on a pullback.
In this closing week, all underlying symbols exceeded our option spread strike prices in the winning directions- some twice! Eight of 10 projected weekly ranges printed, with many being reversal zones.
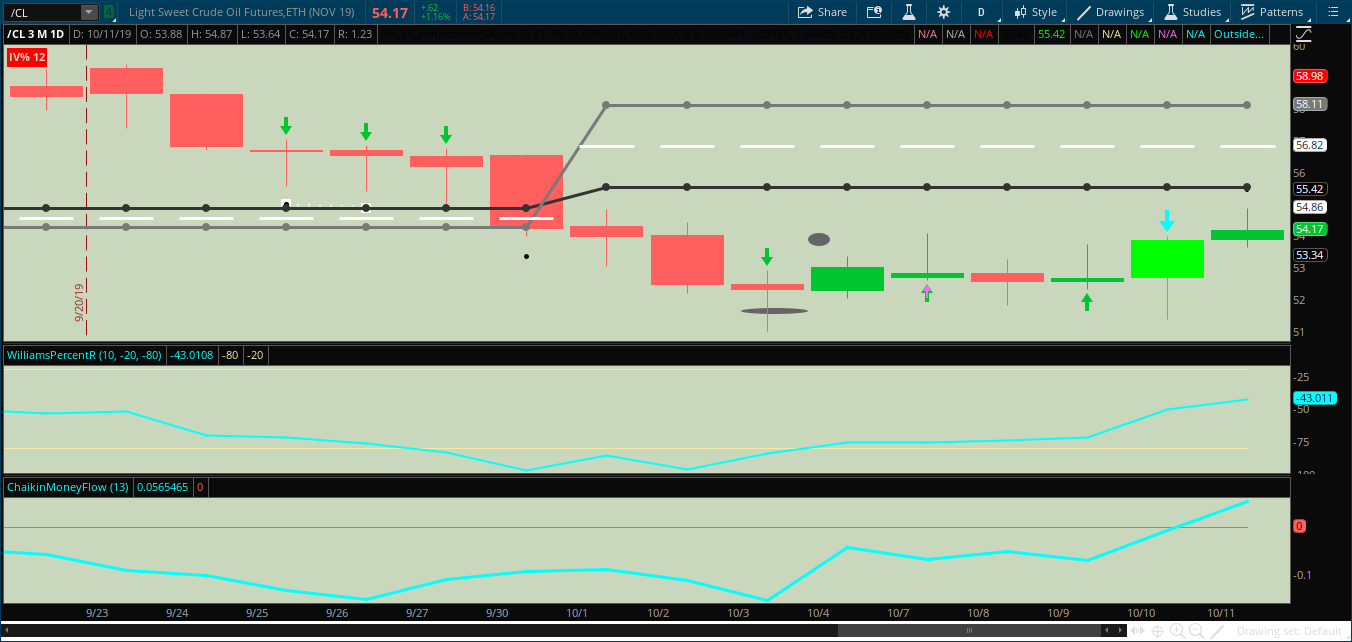
Daily Crude Oil futures illustrating Thursday’s bull engulfing candlestick with understudy support (Williams%R, Chaikin Money Flow). Source: Think or Swim
Next Week’s Predicted Ranges
E-mini S&P 500
High Range 3010-3030; Low Range 2965-2945 (outlier event= 3055 Sept. Monthly Camarilla resistance)
Buy 2995/3000 Weekly call spreads; Rationale: projected range midpoint is overhead; trade small size, as VIX is on supports and a market bear pullback could give energy for new-high attempts Aggressive traders could reverse position at the whole number (3000) buying put spreads if signs present.
Japanese Yen
High Range
Euro FX
High Range 1.116-1.112; Low Range: 1.106-1.103
Buy call spread near 1.1075/1.1 current price call spreads weekly expiration upon throwbacks from overhead moving-average resistance. Rationale: bullish higher time frames
Gold
High Range $1519-$1510; Low Range $1480-$1471
Sell $1490/1495 weekly put spreads on pullbacks. Rationale: Range midpoint is over current price in sideways-action week with some breakout character. I believe option market Delta on $1,500 strike is mispriced & over >58% touch prob.
Crude Oil
High Range $5635-$5327; Low Range $5326-$5220
Sell $5250/52 or $5250/53 weeklies or monthly expiration put spreads on any down moves. Rationale: Daily, Weekly chart candlestick patterns, sideways reversal low next week
Last Week’s Projected Ranges Versus Actuals As of midday, Friday Oct. 11
E-mini S&P 500
High Range 3015-2978; Low Range 2895-2875 (outlier event= 3055 Sept. Monthly Camarilla resistance)
Actual: 2984-2881
Buy Weekly and Monthly Call Spreads 2945/2950 strikes; Rationale: bull candlestick signals multiple time frames, range midpoint is 2945 fair value, unfulfilled 3012 retest overhead
Japanese Yen
High Range 9468-9420; Low Range 9351-9330
Actual: 9417-9252
Sell 9375/9400 call spread, then Buy 9350/9375 call spread if price is under 9350 and reversal rally signals present. Rationale; daily chart inverted hammer sell for the week at next week’s midrange, bullish Oct. candles
Euro FX
High Range 1.110-1.106; Low Range 1.099-1.096
Actual: 1.111-1.099
Buy 1.1/1.1105 call spreads weekly, monthly on pullbacks. Rationale: Bullish weekly, 3-Day candlesticks; weekly range midpoint 1.103 and already holding above it
Gold
High Range $1539-$1529; Low Range $1494-$1484
Actual: $1522-$1483
Buy $1505/1510 weekly/monthly call spreads on pullbacks. Rationale: Bullish weekly chart candle, slightly overbought Daily chart consistent with prior weekly sell bars may throwback down the tail of weekly hammer.
Crude Oil
High Range $5491-$5398; Low Range $5175-$5075
Actual: $5487-$5138
Sell $5250/52 weekly put spread on down moves into next week’s lows. Rationale: Price is out of Bollinger Band value, sideways pivots mean narrow range, moving average supports, volatility rank
See More analysis from Trevor here
Note: Nothing herein shall be construed to be specific financial advice. While reflecting my best good-faith efforts to forecast markets, no guarantees of accuracy are made from my range statistics, aggregate statistics, frequentist interpretations, and pivot math from hand calculations. I am a registered newsletter CTA, and all required disclaimers apply. Trade at your own risk with money you could discard/not miss.


