
While emerging markets are likely to outperform the S&P 500 after years of underperformance, there is a better alternative, notes Joon Choi.
As I read through various equity forecasts from major investment/research firms, I have noticed a common theme: Expectations that emerging market stocks as represented by the iShares MSCI Emerging Markets ETF (EEM) will outperform domestic stocks, represented by the SPDR S&P 500 ETF Trust (SPY). Due to global economic growth concerns, emerging market stocks have returned virtually nothing since May 2011 (after recovering from the financial crisis). I want to recommend a sector that may be a better alternative to EEM.
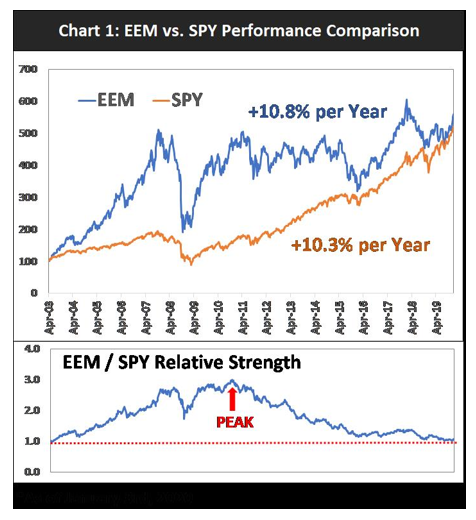
EEM vs. SPY
Since the launch of EEM in May 2003, it managed to outperform SPY by more than 300% in the ensuing four and half years as investors flocked into emerging market stocks (see chart below). Of course, EEM lost a big chunk of its outperformance during the financial crisis but it roared back to life in 2009 as the ETF made a new relative strength high versus SPY in the same year. Moreover, emerging market stocks showed even further relative strength as they reached a new relative peak in April 2011 (red arrow in the chart below). However, EEM has returned just 1.2% per year (compared to 13% for SPY) since reaching that record high apex in relative strength compared to SPY. In all, EEM managed to barely outperform SPY since inception; an annualized return of 10.8% vs. 10.3% respectively.
It’s not surprising that strategists believe emerging market stocks may offer a better bang for the buck than U.S. stocks after such a long period of underperformance. Many point to a relatively higher earning yield for EEM (6.7% vs. 4.3% for SPY) as a reason for their recommendation. But no one mentions that the yield differential favored EEM by 2.6% (7.5% vs. 4.9%) at the beginning of 2016, but it lagged SPY by 3% per year along with 40% higher volatility during the ensuing four years. Higher earnings yields do not necessarily translate to better investments.
EEM vs. XLE
Although SPY is significantly higher than the peak reached in 2007, the Energy Sector SPDR (XLE) is still lower than its 2007 highs (see chart below). Like EEM, XLE has shown minimal gains since April 2011. In fact, it lost 0.3% per year.
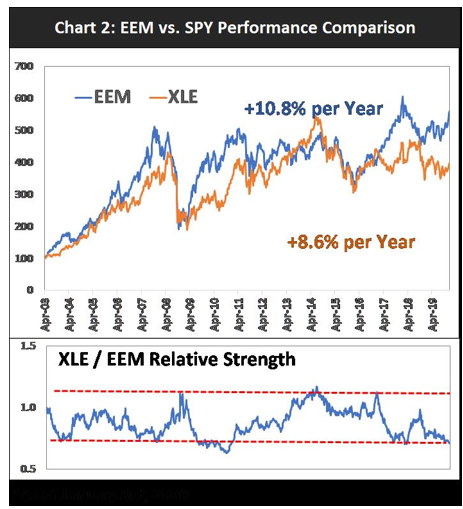
When I charted the relative strength between the two ETFs, the ratio seems to oscillate (bouncing up and down between a channel). This is rather different than the past relationship between EEM and SPY because their relative strength was on a long uptrend from 2003 to 2011 and on a downtrend since. XLE/EEM relative strength appears to be at the bottom of its channel which implies that XLE maybe a better bet than EEM if the history serves as a guide.
Conclusion
After wrapping up a year in which most risky assets appreciated significantly more than their long-term averages, equity performances may be more selective in 2020. Investors may turn their focus on long-term underperformers like emerging markets and the energy sector as they may offer better return potentials. However, I prefer the energy sector (XLE) over emerging market stocks (EEM) if I had to choose between the two as it appears that XLE is at its cyclical relative strength low versus EEM.
Joon Choi is Senior. Portfolio Manager/Research Analyst at Signalert Asset Management. Sign up here for a free three-month subscription to Dr. Marvin Appel’s Systems and Forecasts newsletter, published every other week with hotline access to the most current commentary. No further obligation.


