
Commercial traders are buying Bonds reinforcing yield curve scenario, reports Andy Waldock.
The extreme volatility of the markets has put us in a position of trading less. Volatile markets create wider stop loss values and correspondingly higher risk per position in our pattern-based methodology. Fortunately, the selective calls we’ve made over the last few weeks have worked substantially in our favor.
The Canadian dollar has continued lower; on its march towards a test of support at .7450.
While this short position has been working well, the Australian dollar is showing signs of bottoming. There is a high degree of positive correlation between the Canadian and Australian dollars. This relationship leads to some concern as to whether the Canadian will reach our projected target because the commercial activity in the Australian dollar has shifted sharply to the buy-side (see COT table below). While I expect both markets to make new lows for the move this week, traders should be on the lookout for short-covering opportunities in the Canadian dollar. At the same time, we wait for an outright buy signal in the Australian dollar.
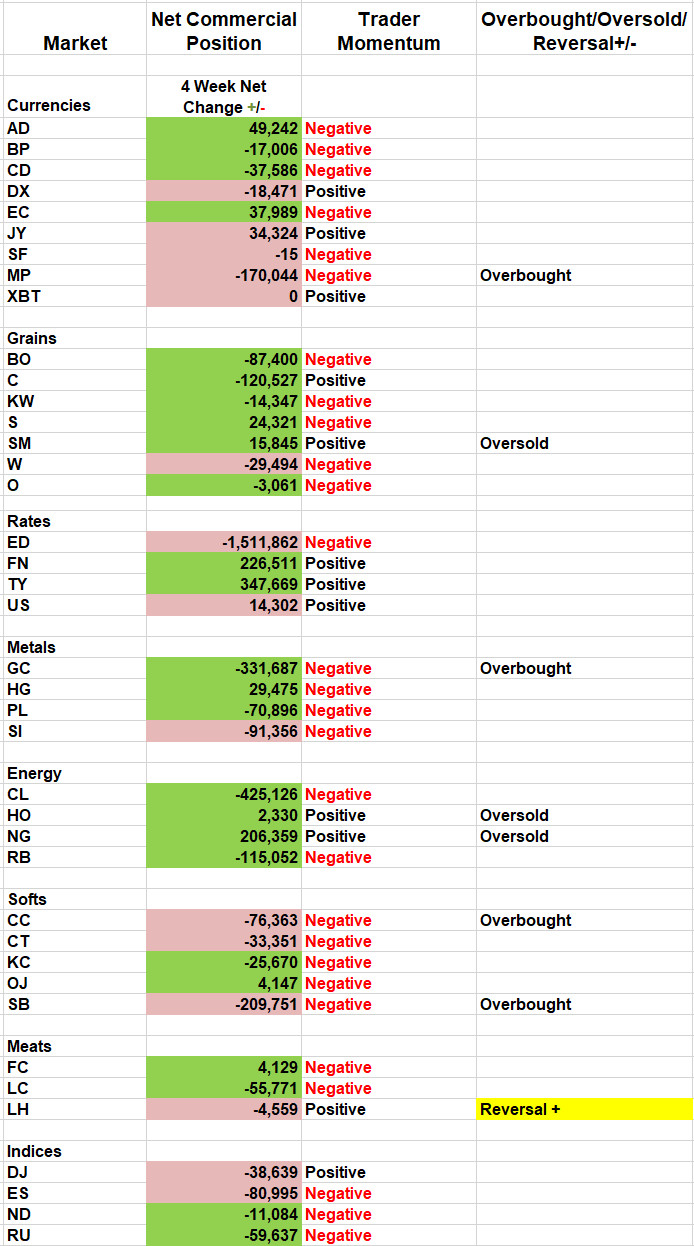
Shifting to the grain markets, we’ve continued to see processors come on the buy-side with each successive decline. The commercial traders just set a new 52-week net long high. We continue to view the current soybean decline from the buy-side.
Meanwhile, in the interest rate sector, commercial traders’ collective actions are reinforcing the inverted yield curve scenario. Last week, commercial traders added more than 100k contracts to their five-year Treasury note position as well as another 75k 10-year Treasury notes, while simultaneously selling 20k 30-year Treasury bonds (see table above). The commercial traders have been very consistent in the application of their inverted yield curve strategies since Christmas.
The copper market has been the victim of pessimistic economic projections as well, having dropped nearly 14% in the last three weeks. Unfortunately, we were stopped out of our short recommendation from Jan. 6 before we could capitalize on the market’s decline. Commercial copper users are now suggesting that the market’s decline has been overdone, as their net position has rapidly increased by 40k+ contracts.
The expected global economic contraction may have hit the energy complex the hardest. The degree of recent volatility has been amazing. Quantifiably, the commercial traders in the heating oil market set a 52-week net short position high on trading activity two standard deviations beyond ordinary ahead of our Jan. 13 short sale signal. Now that the market has fallen by more than 25%, commercial users have stepped in on the buy-side and pushed their net position to a 52-week high, also on much heavier action than would be expected. The rapidity of the fluctuation from sell-side to the buy-side is mind-boggling. We’ve highlighted the heating oil market but, the behavioral and price patterns apply to the unleaded and crude oil markets, as well.
As we said in our Jan. 27 letter, “Watch crude oil. Crude closed right on the upward sloping weekly trend line from the December low. This is the third test, and a failure could wash out the speculative bid, driving prices towards $50 per barrel.”
We got our $50 crude. Attention should now be focused on the buy-side.
View past letters on our site for free. Subscribe to follow along and receive stop levels plus additional commentary. Here is what Andy had to say about seasonality and the COT Report at the TradersEXPO New York. Visit Andy Waldock Trading to learn more. Register and see our daily and weekly signals archive for entries and stop loss levels sent to our subscribers.


