
The market will rebound, but no known cure yet in sight, reports Al Brooks.
The E-mini S&P 500 continues to sell off with no sign of a bottom. It might have to test the 2000 level before a strong short covering rally will begin.
On a yearly chart, each bar is one year. Last year was an extremely big bar and it came late in a bull trend (see chart below). In my final weekend report of 2019, I said that it was probably going to be the end of the bull trend or that there might be one more brief new high and that would be the end. I wrote that there was a parabolic wedge buy climax on that chart and that it would probably lead to a decade of sideways trading.
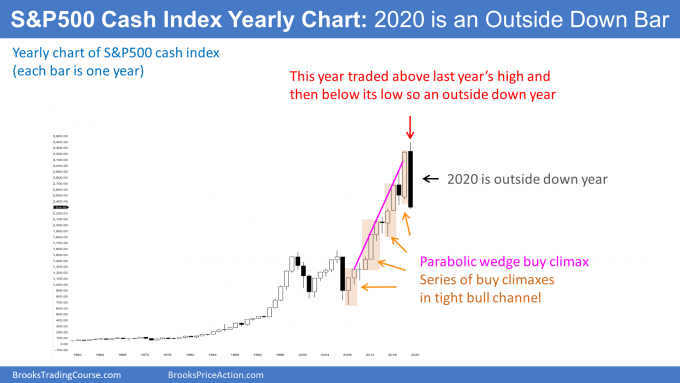
This year traded above last year’s high. It has now also traded below last year’s low. Consequently, 2020 is an outside down bar on the yearly chart. That is a sell signal bar for next year. It will have a higher probability of leading to lower prices if this year closes near its low and below the 2019 low.
What happens after an outside down bar?
When there is a big outside down bar like we have in 2020, usually the next year is not a big bear bar. This is especially true when it comes in a strong bull trend, like we’ve had since 2009. More often, it trades below the low of the outside down bar to trigger the sell signal, but it becomes a weak entry bar. If it closes near its high, it is a High 1 buy signal bar for the next year.
Sometimes the bar after an outside down bar is an inside bar. That means that next year’s low would be above this year’s low and its high would be below this year’s high. There would then be an inside-outside-inside (ioi) pattern, which is a Breakout Mode pattern. The entry up or down would come in the following year, which would be 2022. This is getting too far ahead, but it is helpful to think about it.
There is one other point to remember. If 2021 is an inside bar, or if it trades below this year’s low and then rallies, it will overlap a lot of this year’s range. In both cases, there would then be three sideways bars on the yearly chart.
I have made the point repeatedly over the past two years that the stock market will probably be in a trading range for about a decade. Three sideways bars are the start of a small trading range.
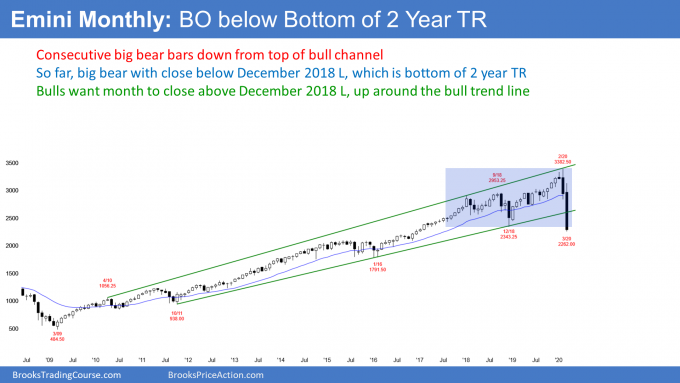
The E-mini S&P 500 futures has a big bear body for March on its monthly chart. It has broken below the 11-year bull trend line and the bottom of the two-year trading range (see chart below).
There are seven trading days left in March. They can change the appearance of this month’s candlestick. Depending on how the month closes, April could be bullish or bearish.
The bull trend line is currently around 2600. If the bulls get a reversal up to above that trend line, there would be a big tail on the bottom of the March candlestick. While consecutive big bear bodies make a second leg sideways to down likely, a big tail reduces the chance of a big selloff in April. Traders will wonder if the E-mini was finding support at the December 2018 low. That is the bottom of the two-year range.
A big tail would reduce the chance of April falling below the March low. Furthermore, it would increase the chance of the E-mini trading sideways to up for the next month or two.
Traders saw the 11-year bull trend line and that December 2018 low as major support. Also, the stock market often bounces when it falls 10, 20, 30 or 50%. These numbers are therefore additional support. A 30% selloff is particularly important because that is the average lowest selloff when the E-mini enters a bear market.
E-mini testing major support
The lowest close this week for the S&P 500 cash index was on Friday. It was 32% below the all-time highest close of Feb. 19. That is about a 30% correction. Consequently, this week tested all three support levels (the bottom of the two-year trading range, the 11-year bull trend line, and a 30% pullback level).
Traders are deciding it the bears will begin to cover their shorts around the current support and if strong bulls will start to buy, expecting a short covering rally. If there is strong short covering, this month could close back above the bull trend line, which is around 2600.
If the month closes on its low, it will also close below the December 2018 low. Traders would see that low as a breakout point. Since the two-year trading range is about 1000 points tall, they will wonder if there would be a measured move down to around 1300.
That would be a 62% correction (very near the 61.8% Fibonacci retracement line). There is only a 20% chance of that now. The best the bears can probably get before a short covering rally is a test of the bottom of the 2014-2015 trading range at around 1800. That would represent almost a 50% correction. There is a 30% chance of the E-mini reaching that before there is a bear rally.
Testing the price at the start of President’s Trump’s term
The E-mini formed its fifth consecutive big bear bar last week on the weekly chart. Furthermore, it closed below the December 2018 low, which was the bottom of a two-year trading range (see chart below).
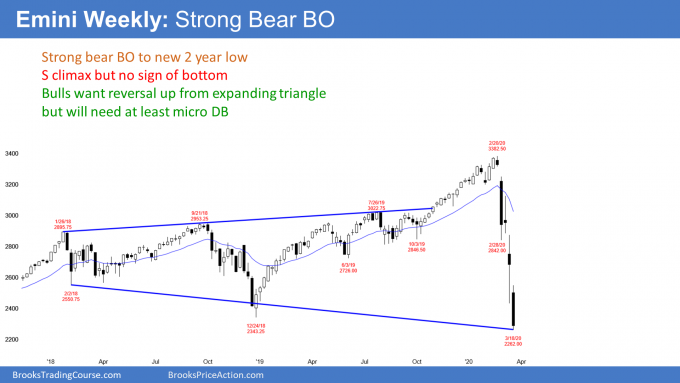
If the bulls get a reversal up within the next few weeks, that low would be the third leg down in an expanding triangle. The first two are the February and December 2018 lows. Traders would then expect a rally back to at least the middle of the two-year triangle. That would retrace about half of the bear trend.
The E-mini is in a sell climax on the daily chart (see below). Sell climaxes can fall far further than what seems reasonable. There is no reversal up yet. Traders on Wall Street sometimes say something like, “Being cheap is a bad timing tool.” Just because the market seems cheap, it can get much cheaper, and it is not necessarily a good time to buy. In fact, when the market collapses, it still might be expensive based on the new economic conditions. You will know in hindsight if it falls a lot more.
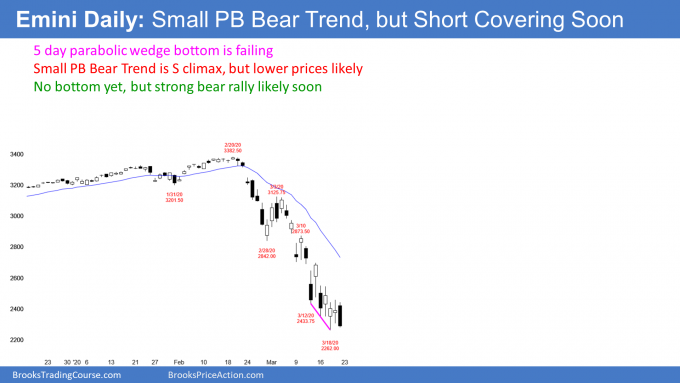
The first leg down was a huge break below the four-month bull trend line on the daily chart. It was a spike down to the Feb. 28 low. There was then a three-day pullback to the March 3 high and then a resumption of the bear trend.
The March 3 high was the start of a parabolic wedge bear channel. That is a tight bear channel with at least three pushes (sell climaxes) down. This selloff had five brief legs down. The last three were over five days and formed a micro wedge bottom. It was nested into the end of the two-week parabolic wedge sell climax. A nested wedge selloff has a higher probability of leading to a reversal up.
Reversing all of the gains of the Trump Presidency
The E-mini dipped below the Jan. 20, 2017 open on Wednesday and reversed up. On Friday, it fell below it again, but closed just a little bit above. That was the start of the Trump presidency. Therefore, the stock market has almost erased all of its gains since President Trump took office. The cash index has not quite reached its open from that day. Trades can read into it whatever they want, but the market is clearly paying attention to the start of his presidency.
Bulls want signs of buying pressure
While this week had several bull days, they all had small bodies. Also, there were no consecutive big bull bars closing on their highs. Traders want to see that before concluding that a short covering rally is underway. The bears who did not yet buy back their shorts will buy in a panic. The bulls will buy as well.
Both the bulls and bears know that a short covering rally in an extreme sell climax typically has at least a couple legs sideways to up. They also expect it to last about 10 bars or more.
Because this selloff was particularly severe, the short covering rally could last a lot longer than two weeks. A logical target would be around 3000. That is a Big Round Number and it was resistance several times in 2018 and 2019.
Can this be a V bottom, like in January 2019?
No. First of all, only about 20% of sell climaxes immediately reverse up into a bull trend. Therefore, V bottoms are rare, which means that any upcoming bottom will probably not be like the one from last year.
If the upcoming short covering rally will not be the resumption of the 12-year bull trend, what will happen? There might be a rally for a month or two that would be a credible start of a V-bottom reversal. However, there is an 80% chance that the rally would be minor. A minor reversal is one that does not lead to an opposite trend.
It is either a bull leg in a trading range or a bear flag. In either case, traders should expect a test of the bottom of the current sell climax. When there is a test, there is often a rally from a double bottom. That has a 40% chance of beginning bull trend.
Extreme buy climaxes lead to extreme trading ranges
This month-long selloff is extremely strong. It is similar to the first leg down in the 1929 Crash. There was then a second leg down. And then a third, and many more legs down. The bear trend did not end until the stock market lost almost 90% of its value. While there might be a wedge selloff (three legs down) over the next year and the market will probably lose at least 40% of its value, it will not lose 90%.
Starting at the end of 2017, I repeatedly said that the late 2017 rally was the most extreme in the 100+ years of the stock market. I said that it would lead to a pullback for many months. But I also said every pullback was just that, which is a pause in a bull trend. Traders should expect higher prices to follow every pullback. Additionally, I said many times that the buy climax was coming late in a bull trend and that there would probably be a major top within a few years.
Trading range likely to last about a decade
Finally, I often compared it to the rallies in the 1960’s and 1990’s. Both led to trading ranges that lasted about 10 years. Each also had at least a couple pullbacks of 40% or more. I therefore said that the 2020’s would probably be a decade-long trading range and that there would be at least a couple 40% to 50% pullbacks.
This selloff is a likely start of a decade long trading range. The bulls typically get a new high about two years after a bear trend ends. On average a bear trend lasts about a year. Consequently, there might be a new all-time high in about three years. However, it will probably not get far above this February’s high. It would just be a bear leg in a developing 10-year trading range. Traders should then expect another 40+% selloff from that high.
What to expect this week
The daily chart is in a parabolic wedge sell climax. That is also a Small Pullback Bear Trend. There is no sign of a bottom. Traders continue to expect lower prices.
The next target is the 2000 Big Round Number. But a strong short covering rally can begin at any time. You will know it when you see it because the buying will be obvious and relentless. Until then, the bear trend will continue down.
Trading Room
Traders can see the end of the day bar-by-bar price action report by signing up for free at BrooksPriceAction.com. I talk about the detailed E-mini price action real-time throughout the day in the BrooksPriceAction.com trading room. We offer a two-day free trial.


