
With the rapid growth of the options market, the simple Put/Call Ratio has become a staple technical indicator. Simply dividing total put volume by total call volume allegedly provides insights into investor sentiment, or so it goes. But, the problem with the Simple P/C Ratio’s validity is it tells us absolutely nothing about trade direction. Bearish buy and bullish sell orders in puts are lumped into simple volume, making it ambiguously useless.
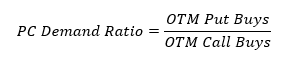
The Put/Call Demand Ratio solves this issue by providing a superior indicator of investor demand by explicitly indicating buy orders. Trades are narrowed down to only include out-of-the-money (OTM) options, since OTM order flow has the greatest influence on implied volatility, and trades in the OTM region are more likely to be information driven. Here it is written out:
The graph below plots the new P/C Demand Ratio against the Simple P/C Ratio over the last two years. The P/C Demand Ratio average is 1.8, indicating put buys largely outpace call buys on the index. P/C Demand Ratio has significantly more variation than the Simple P/C Ratio. The correlation between the two variables is also surprisingly weak at 0.016, signifying P/C Demand Ratio is not redundant.
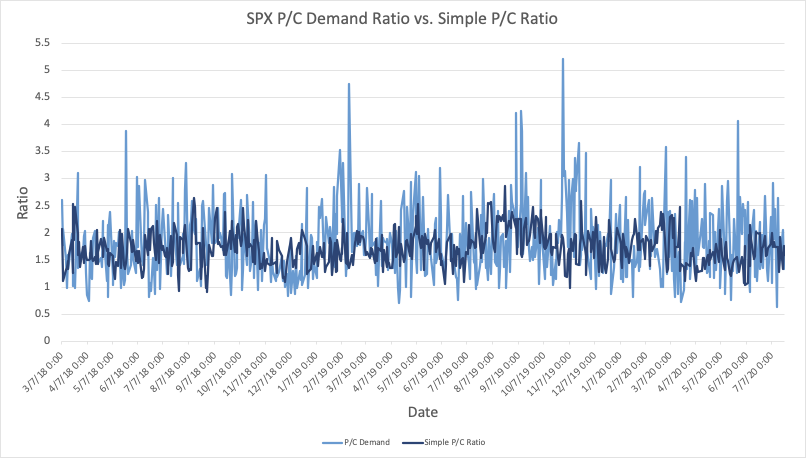
Source : OptionMetrics
Option Demand Theory suggests that options order flow will impact implied volatility. In a world in imperfect markets, excess demand for put options precedes higher volatility. Let’s test this theory in a simple linear regression of the next day VIX change:
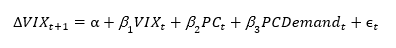
This specification tests whether P/C Demand Ratio has any predictive power for the change in the next day implied volatility. The current level of the VIX is used as a control variable.
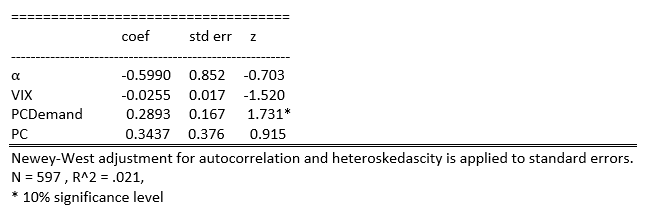
These results indicate that P/C Demand Ratio is positively related to next period VIX changes, which has significance at the 10% level. This coefficient is marginal, and does not call for a victory lap quite yet. But, it does indicate that an increase relative to put buying precedes an increase in volatility on the following day. The Simple P/C Ratio does not have a statistically significant relationship.
However, there is reason to believe P/C Demand Ratio’s predictive power varies based on the current volatility regime. From a microstructure perspective, the market maker bears more inventory risk when the underlying asset is more volatile. Any subsequent order flow will have a greater price (future volatility) impact as hedging costs for the market maker grow. This theory can be tested by adding an interaction variable between P/C Demand Ratio and current VIX level:
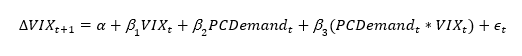
This new regression tests whether P/C Demand Ratio’s predictive power varies based on the current VIX level.
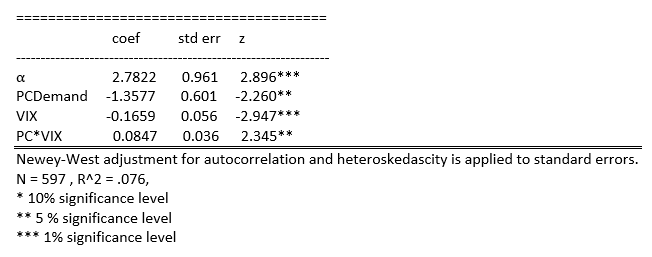
This new set of results point to increased predictive power of P/C Demand Ratio when conditioned on current volatility. The coefficient of the interaction term is positive and significant at a 5% level, implying that increased put buying during high vol regimes precedes larger VIX increases.
Is it a Sentiment Indicator?
The above evidence elicits promise for P/C Demand Ratio as a tool for trend following strategies. Put buying precedes higher volatility, which supports the momentum into market lows. Sadly, any rigorous analysis of its predictive strength at varying investment horizons will be left to another day.
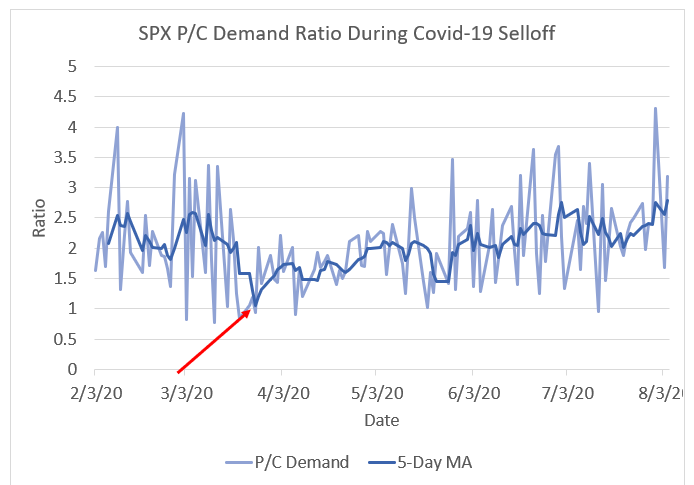
However, I will leave off with this graph, which plots the ratio and its five-day moving average:
Source: OptionMetrics
The red arrow indicates the low moving average of P/C Demand Ratio over this period. On March 26, the moving average reached a level of 1, signifying equal OTM put to call buying over the last five trading days. This closely coincides with the market bottom on March 23, signifying put purchasing was exhausted by investors.
Garrett DeSimone, Ph.D., is Head of Quantitative Research at OptionMetrics


