
As investors look for potential new trends and growth companies in the markets, a still-evolving industry of electric vehicles shows significant promise as these companies enter markets with new entrants, states Suri Duddella.
This growth has helped a few EV company stocks to grow parabolic. Here we highlight how to trade parabolic arc patterns with few examples.
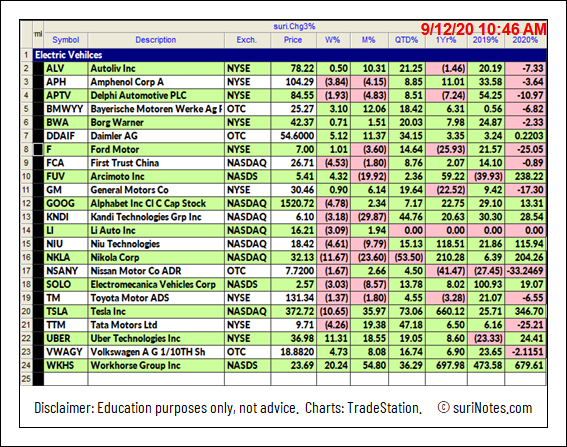
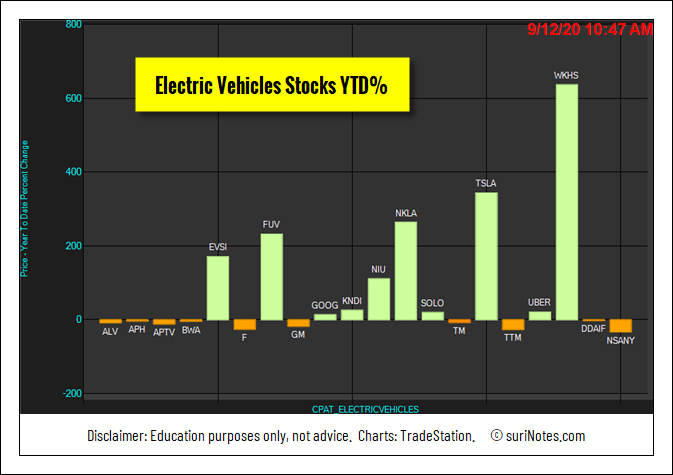
List of electric vehicles companies and their performances in 2019 and 2020.
Parabolic Arc Patterns
Parabolic arc chart patterns form when a steep rise in prices caused by irrational buying and intense speculation. Parabolic arc patterns are rare, but they are reliable and are generated in mega-bull trends. These patterns trend gradually making higher highs and lower lows in the beginning stages but can be volatile in the exhaustion and reversal stages. Irrational buying in public generates a strong rally to push prices vertically, followed by a steep sell-off. Examples of these market types are the NASDAQ bullish markets during 1990-2000 (retraced 80%) and gold prices from 2000-2011 (retraced 62%).
Parabolic arc is a reversal pattern and has a very predictable outcome. Although these patterns are predictable, they are relatively difficult to trade since the market sentiment is bullish and may be fairly tough to point reversals to trade. Most parabolic arc patterns have a significant correction of 62-79% of its price rise (from the top).
Once parabolic arc patterns reach their target of 62-79%, they tend to reverse as an oversold bounce. Usually these bounces are between 25-50% of its prior fall range from the peak.
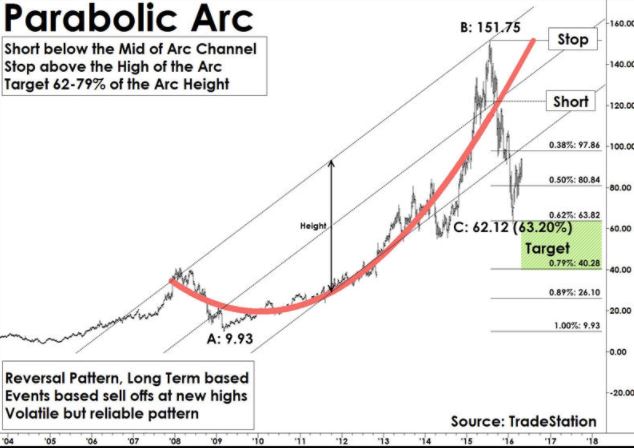
Trade: In parabolic arc patterns, prices move up vertically and eventually, the acceleration comes to a stop and then reverses. Prices start showing lower lows and may attempt to regain the top again. Draw a channel connecting the top and bottom of the pattern. Enter a “short” trade at the breakdown of the channel trend line connecting the pattern high and pattern lows.
Target: Measure the distance of the rise from the base to the top of the pattern. Most parabolic arc patterns return to the 62-79% of its rise. 50% is the first target.
Stop: Protect the trade by placing a few ticks above the high of the parabolic arc.
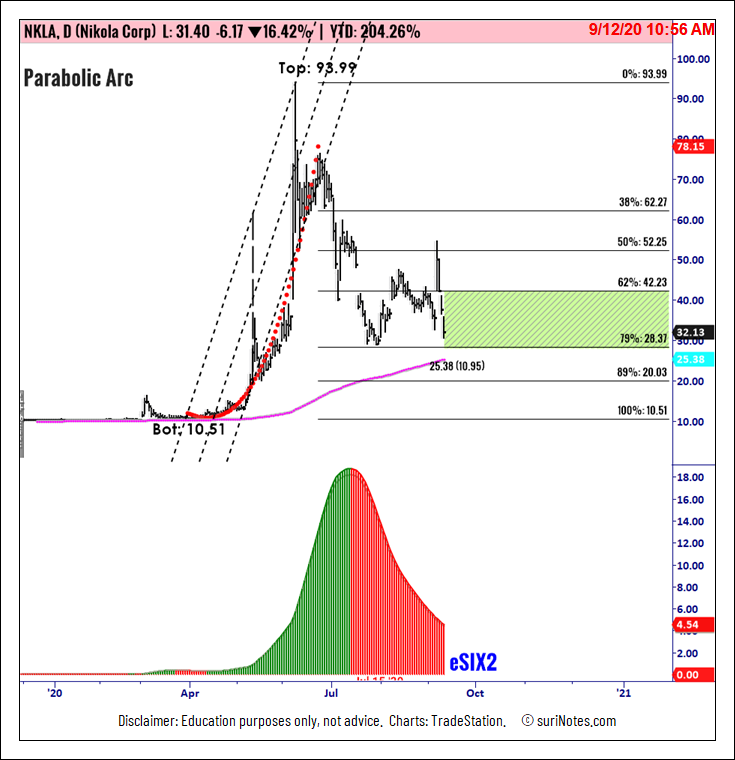
Nikola Corp. (NKLA) Parabolic Arc Pattern
Nikola Corp (NKLA) has formed a parabolic arc pattern on its daily chart (see below). The pattern forms a low of $10.51 in April 2020 to a high of $93.99 in June 2020. Parabolic arc patterns are long-term patterns, but most of the upside parabolic patterns return to at least 50% to 62% of its prior rise in a correction mode. NKLA gave a sell signal end of June 2020 but a bearish trend confirmation (eSIX) came mid-July to short below $52. Targets are set near 50-62% of its prior range ($28-$42). NKLA reached its target 1 zone.
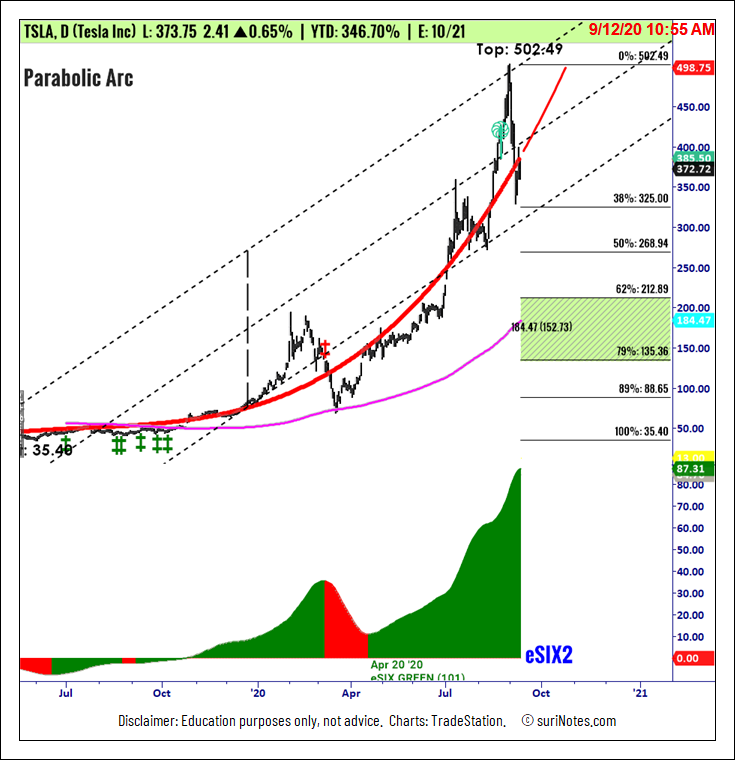
Tesla Inc. (TSLA) Parabolic Arc Pattern
Tesla Corp (TSLA) has formed a parabolic arc pattern on its daily chart (see below). The pattern formed a low of $35.40 in March 2019 to a high of $502.49 in September 2020. Parabolic Arc patterns are long-term patterns, but most of the upside parabolic patterns return to at least 50% to 62% of its prior rise in a correction mode. Currently, the TSLA parabolic pattern does not have a trade signal yet, but a short trade may be entered when the price starts to correct the trend channels confirming the underlying bearish trend in eSIX. With the current parabolic arc high and low readings, the targets may be set near 50% to 62% of its parabolic arc range.
To learn more about Suri Duddella, please visit SuriNotes.com.


