Trader JW Jones believes this is a critical point where set-ups may begin to emerge across a variety of key markets, including stocks, commodities like gold, silver, and oil, and the dollar.
In doing some brief reading around the blogosphere, I have noticed that most pundits are writing off gold, silver, and oil entirely. In fact, I have even read that the selloff is just beginning in precious metals and energy.
In addition to the bearish traders, it seems as though even more traders are expecting some period of consolidation. Lower prices and a period of consolidation make sense, but what I am more interested in at this stage is a clear set-up that offers solid risk/reward.
In basic terms, I try to identify key price levels and then allow price action to generate signals about Mr. Market’s preferred direction, regardless of the underlying asset.
Trading is an undertaking where operating with defined risk is paramount to both survival and success. Leveraging probability and focusing on trade/money management represent the other side of success.
With that said, I am currently sitting in cash while waiting for set-ups to emerge. The following analysis should be viewed merely as a context of price action and not a catalyst(s). Technical analysis is only one view of the marketplace, and often times it proves to be contradictory to Mr. Market’s plans.
Currently, I have differing views on various asset classes as it relates to risk and sensitivity to the US dollar. As of mid-morning on Monday, May 23, price action in the S&P 500 and oil was ugly, as European debt issues still loomed large over global financial markets.
The debt issues in the Eurozone were pushing prices of the US dollar index higher while the euro tested critical support. On Tuesday, we were seeing higher prices in risk assets, although the S&P 500 was lagging behind gold, silver, and oil.
For readers who have been reading my work in the recent past, I have not made any predictions, but instead typically offered both sides of the price action and allowed individual investors and traders to come to their own conclusions.
I generally do not trust financial writers or pundits who are always biased about price direction because often times I feel like they are pumping their book or hoping to get viewers or readers to follow them into their recommended positions.
I have long realized that when the market gets choppy, I like to remain in cash and wait for solid set-ups. Right now, the S&P 500 looks like it could go in either direction, but the day/week is still far from over, and Thursday’s closing bell has not been heard. The following analysis is my current view of the marketplace.
NEXT: Latest Analysis of S&P 500, Dollar Index
|pagebreak|S&P 500
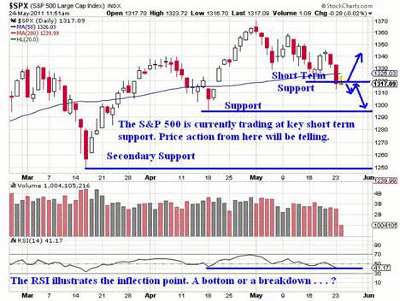
Currently, the S&P 500 Index is trading right at a key support level. Solid volume accompanied lower prices on Tuesday, as represented by the S&P 500 E-Mini futures contracts, as well as the S&P 500 Index ETF (SPY).
I am going to be watching price action closely over the next few days to see how the S&P 500 index handles the current support level. Right now, SPX looks poised to break down, but a later bounce could push the index back above the key support level, and an extension higher could be seen as making a potential reversal more likely.
The close on Thursday and Friday should provide traders with clues about where the S&P 500 is headed. The daily chart of SPX shown below illustrates the key support levels in the short term:
US Dollar Index
The US dollar selling pressure is being largely dismissed by the S&P 500, but other risk assets, such as gold, silver, and oil are benefitting.
I have been focusing on the US dollar for weeks, and right now, risk assets are trading primarily in the opposite direction of the dollar. Obviously, there are exceptions to the rule, but a strong dollar has meant lower equity and oil prices specifically.
Gold and silver have been holding up well, as fearful investors are using gold and silver as safe havens against the potential for a European debt default or a euro currency crisis.
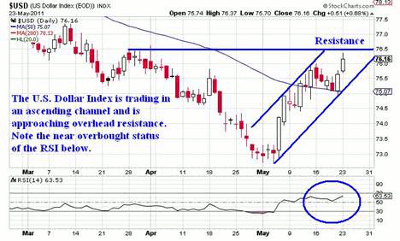
The US dollar may have put in a key pivot low on the daily chart back in the early part of May. In addition, the key 200-period moving average is overhead, and the US dollar may be poised to test the key price level in the future. The daily chart of the dollar index can be seen below:
While the dollar could roll over and probe lower, the fact that it has put in a higher low and broken out above recent highs is bullish. Similar to the S&P 500, the next few daily closes are going to be critical as it relates to risk assets. I will be monitoring the dollar’s price action quite closely looking for a clue about where equities may be headed.
NEXT: What to Watch in Gold and Crude Oil
|pagebreak|Gold
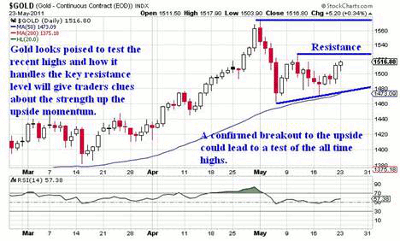
Gold has not sold off to the same degree as silver, and so far, the 50-period moving average on the daily chart has offered key support.
I would not be surprised to see the rally in gold continue in coming days and weeks, as the situation in Europe will likely be at the forefront of headlines in the near term.
It is possible for gold futures to push higher and possibly attack and test the recent highs. If we do get a strong extension higher in gold, I would expect a blow-off top and a subsequent selloff that is quite deliberate and nasty.
I think in the short term, we could see gold put in new highs and possibly climb above the key $1,600-per-ounce price level. However, if we do get a strong extension higher, I will expect to see sellers beginning to step in if price gets above $1,600. The daily gold futures chart is shown below:
Crude Oil
Analysts from Goldman Sachs are declaring that oil prices will likely increase in the near to intermediate term. Price action so far this week has just about totally negated the nasty red candle from Monday.
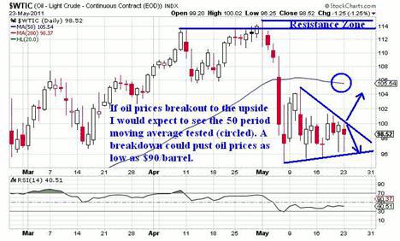
Oil continues to consolidate near the lows and will eventually either break down to new lows and possibly test the 200-period moving average, or we will see an extension higher to the $103 - $105 per barrel price level. The daily chart of oil futures is shown below:
In the longer term, I remain extremely bullish on energy, as the fundamentals indicate that oil demand will likely continue to rise while supply levels remain flat or begin to increase.
Oil prices are likely to go much higher than what most analysts are expecting. For now, I’m going to be watching the key support level illustrated above. If oil prices continue to consolidate at these levels, a breakout is nearly inevitable. The question remains which way will oil break?
NEXT: What's Ahead for Volatile Silver Futures
|pagebreak|Silver Futures
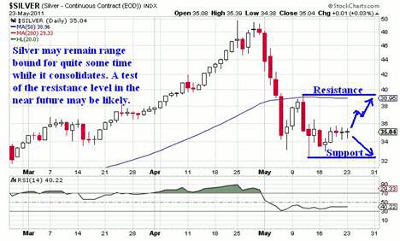
Silver futures have rallied on the weak price action in the US dollar. Silver is on target to test the 23.6% Fibonacci retracement level. Silver looks relatively strong here, and if prices continue to work higher, I would expect to see silver prices reach as high as $41.25 before sellers take back control. The daily chart of silver futures is shown below:
The consolidation that I am seeing in silver reminds me that the underlying demand for silver is still there. If the dollar continues to weaken, or more money pours into silver as a safety hedge away from the euro currency, we could see silver put on a strong run higher before ultimately selling off again.
Silver futures trade with increased volatility during specific periods of time. I am going to continue to monitor the price action in the US dollar, gold, and silver.
Conclusion
I continue to watch price action while waiting for a solid set-up to form before getting involved in the markets. I realize that precious metals and oil have traded higher this week, but both are the products of a weaker US dollar.
It remains to be seen whether we’ll continue to see stocks sell off. In terms of the price action in the S&P 500, I continue to wait to see if we get a clear-cut set-up. What I do know is taking an anticipatory trade on the S&P 500 is a great way to lose money, and I hate losing money, so I will remain in cash in the short run and let price action dictate my next trade.
In my opinion, we are sitting at a key inflection point that is going to tell us a great deal about the tenor of the marketplace. When we get a failed break or a key breakout, it should provide traders with clues about Mr. Market’s intentions. Until then, we will have to sit back and wait patiently for prudent set-ups to transpire.
By JW Jones of OptionsTradingSignals.com


