

Now that earnings season is underway, many companies will be releasing their second quarter results over the coming weeks, writes Mary-Lynn Cesar on Kapitall.com.
For the following screen, we set out to find out promising investment opportunities amongst those that will report their earnings the week of July 15-19. If you're looking to trade on earnings season, you may find our list of stocks quite appealing.
Investing Ideas
To begin, we screened the aforementioned group of companies for firms that have a strong history of posting earnings that beat expectations, commonly referred to as a positive earnings surprise. Specifically, we looked for companies that have reported earnings per share (EPS) above the expected EPS for the last four consecutive quarters. It's also worth mentioning that the difference between the actual and expected EPS doesn't have to be huge for it to count; a difference of a few cents is still a positive earnings surprise. And while past performance isn't indicative of future returns, four or more quarters of positive earnings surprises may suggest that a company is being consistently undervalued by investors.
Next, we decided to narrow down that list by taking a closer look at the profitability of the remaining companies. To do this, we used the DuPont equation to analyze the firms' return on equity (ROE). ROE is essentially a company’s net profits divided by its average equity. Typically, the higher the ROE, the more profitable the company.
DuPont stretches the ROE equation into 3 parts:
= (Net Profit/Equity)
= (Net profit/Sales)*(Sales/Assets)*(Assets/Equity)
= (Net Profit margin)*(Asset turnover)*(Leverage ratio)
This enables us to examine the strength of a company’s major sources of profitability. Generally, an increase in net profits or asset efficiency is viewed as a positive source of growth, while an increase in leverage ratio (debt) is viewed as a negative. So for our purposes, we screened for companies with an increasing net profit margin and asset turnover, and a decreasing leverage ratio. Companies satisfying that requirement are experiencing rising profits due to operations and not increased use of leverage.
The List
Do you think these companies will deliver a fifth quarter of positive earnings surprises? Use this list as a starting point for your own analysis.
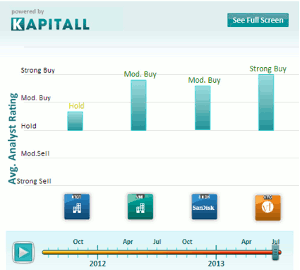
chart courtesy of StockCharts.com
Click to Enlarge
1. NetScout Systems, Inc. (NTCT): Engages in the design, development, manufacture, marketing, sale, and support of unified service delivery management, service assurance, and application and network performance management solutions worldwide.
Market cap at $1.01B, most recent closing price at $24.36.
In Jun 2012: Reported EPS at 0.19 vs. estimate at 0.18 (surprise of 5.6%). In Sep 2012: Reported EPS at 0.34 vs. estimate at 0.26 (surprise of 30.8%). In Dec 2012: Reported EPS at 0.36 vs. estimate at 0.35 (surprise of 2.9%). In Mar 2013: Reported 0.43 vs. estimate at 0.41 (surprise of 4.9%. [Average earnings surprise at 11.05%].
MRQ net profit margin at 14.83% vs. 14.48% y/y. MRQ sales/assets at 0.178 vs. 0.158 y/y. MRQ assets/equity at 1.485 vs. 1.658 y/y.
NetScout Systems will report its first quarter fiscal year 2014 results on July 18.
2. Valmont Industries, Inc. (VMI): Produces and sells fabricated metal products, pole and tower structures, and mechanized irrigation systems in the United States and internationally.
Market cap at $3.97B, most recent closing price at $149.22.
In Jun 2012: Reported EPS at 2.24 vs. estimate at 2.16 (surprise of 3.7%). In Sep 2012: Reported EPS at 2.12 vs. estimate at 2.05 (surprise of 3.4%). In Dec 2012: Reported EPS at 2.43 vs. estimate at 2.21 (surprise of 10%). In Mar 2013: Reported 2.77 vs. estimate at 2.52 (surprise of 9.9%. [Average earnings surprise at 6.75%].
MRQ net profit margin at 9.46% vs. 7.29% y/y. MRQ sales/assets at 0.313 vs. 0.301 y/y. MRQ assets/equity at 1.857 vs. 1.945 y/y.
Valmont Industries will report its second quarter 2013 results on July 17.
3. SanDisk Corp. (SNDK): Designs, develops, manufactures, and markets NAND-based flash data storage card products that are used in various consumer electronics products.
Market cap at $14.51B, most recent closing price at $59.83.
In Jun 2012: Reported EPS at 0.21 vs. estimate at 0.18 (surprise of 16.7%). In Sep 2012: Reported EPS at 0.48 vs. estimate at 0.33 (surprise of 45.5%). In Dec 2012: Reported EPS at 1.05 vs. estimate at 0.76 (surprise of 38.2%). In Mar 2013: Reported 0.84 vs. estimate at 0.79 (surprise of 6.3%. [Average earnings surprise at 26.67%].
MRQ net profit margin at 12.4% vs. 9.49% y/y. MRQ sales/assets at 0.129 vs. 0.12 y/y. MRQ assets/equity at 1.417 vs. 1.424 y/y.
SanDisk Corp. will report its second quarter 2013 results on July 17.
4. V.F. Corporation (VFC): Designs and manufactures, or sources from independent contractors various apparel and footwear products primarily in the United States and Europe.
Market cap at $21.78B, most recent closing price at $197.89.
In Jun 2012: Reported EPS at 1.11 vs. estimate at 0.94 (surprise of 18.1%). In Sep 2012: Reported EPS at 3.52 vs. estimate at 3.49 (surprise of 0.9%). In Dec 2012: Reported EPS at 3.07 vs. estimate at 3.03 (surprise of 1.3%). In Mar 2013: Reported 2.43 vs. estimate at 2.19 (surprise of 11%. [Average earnings surprise at 7.82%].
MRQ net profit margin at 10.35% vs. 8.42% y/y. MRQ sales/assets at 0.275 vs. 0.269 y/y. MRQ assets/equity at 1.865 vs. 2.134 y/y.
V.F. Corporation will report its second quarter 2013 results on July 19.
Profitability data sourced from Google Finance. All other data sourced from Finviz.
By Mary-Lynn Cesar of Kapitall.com


