

In part 1 of our commentary on U.S. markets, we discussed the current Fundamental Gravity of our “U.S. Shift Work” macro theme. If you missed part 1, I would encourage you to read through that first, before jumping into part 2 here, writes Landon Whaley Friday.
We covered a great deal of critical economic and central bank developments, which are bullishly impacting U.S. utilities and the US-listed ETF, Utilities Select Sector SPDR ETF (XLU).
The Fundamental Gravity bottom line is that we are witnessing the U.S. Growth a Go-Go theme passing the baton to the U.S. Shift Work macro theme. Asset classes that perform well when U.S. growth slows bottomed between late April and June. Now, starting with the July data, we are starting to see chinks in the U.S. growth armor, which is bullish development for XLU.
Quantitative Gravity says what?
As a quick reminder, the Quantitative Gravity component of our Gravitational Framework is not technical analysis, which is ineffective and misleading. Rather, we use quantitative measures based on the reality that financial markets are a nonlinear, chaotic system.
We’ve identified four primary quantitative dimensions of financial markets that affect price movement: energy (trend), force (momentum), rate of force (buying pressure), and a market’s irregularity (level of imminent drawdown risk).
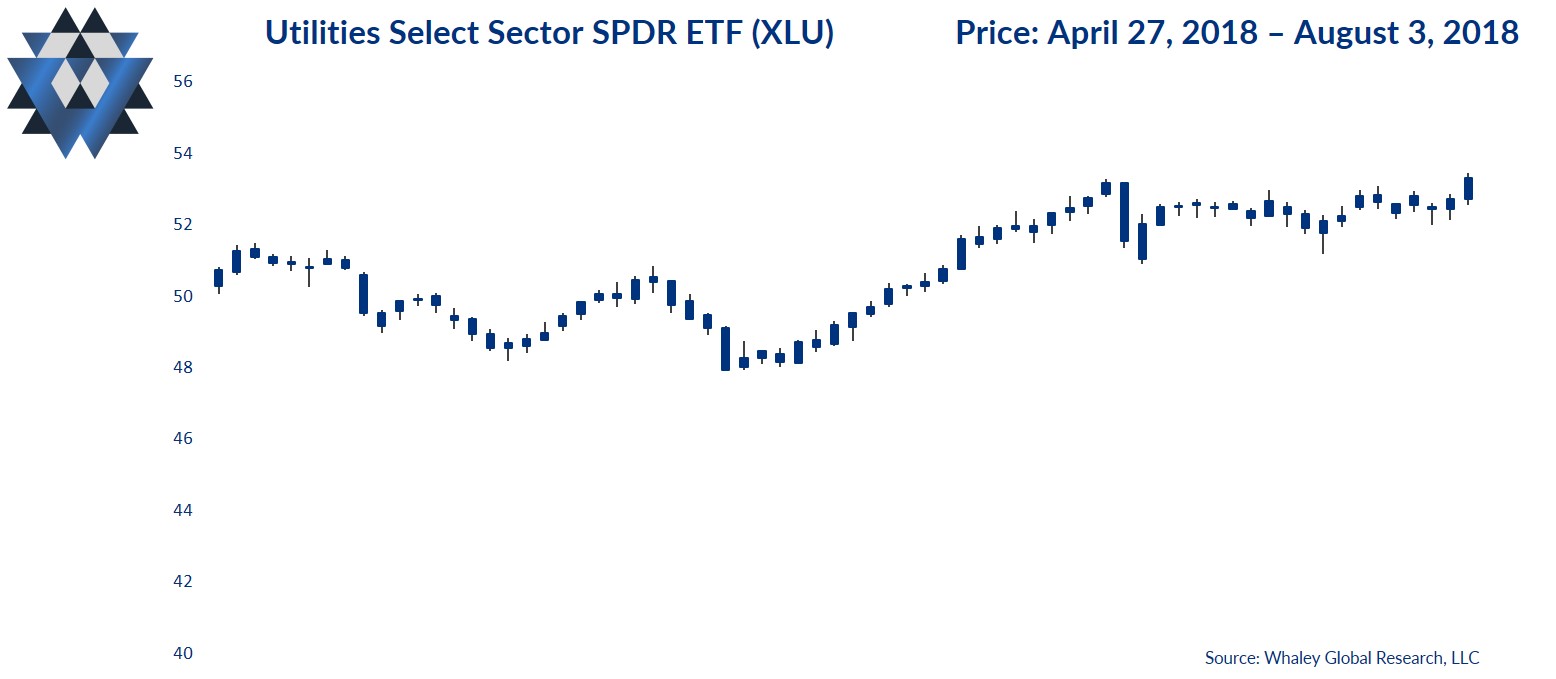
Social is our measure of a market’s current energy (or trend). XLU’s Social reading indicates it remains in party mode. For the uninitiated, when a market is partying, it’s in an extremely bullish trend.
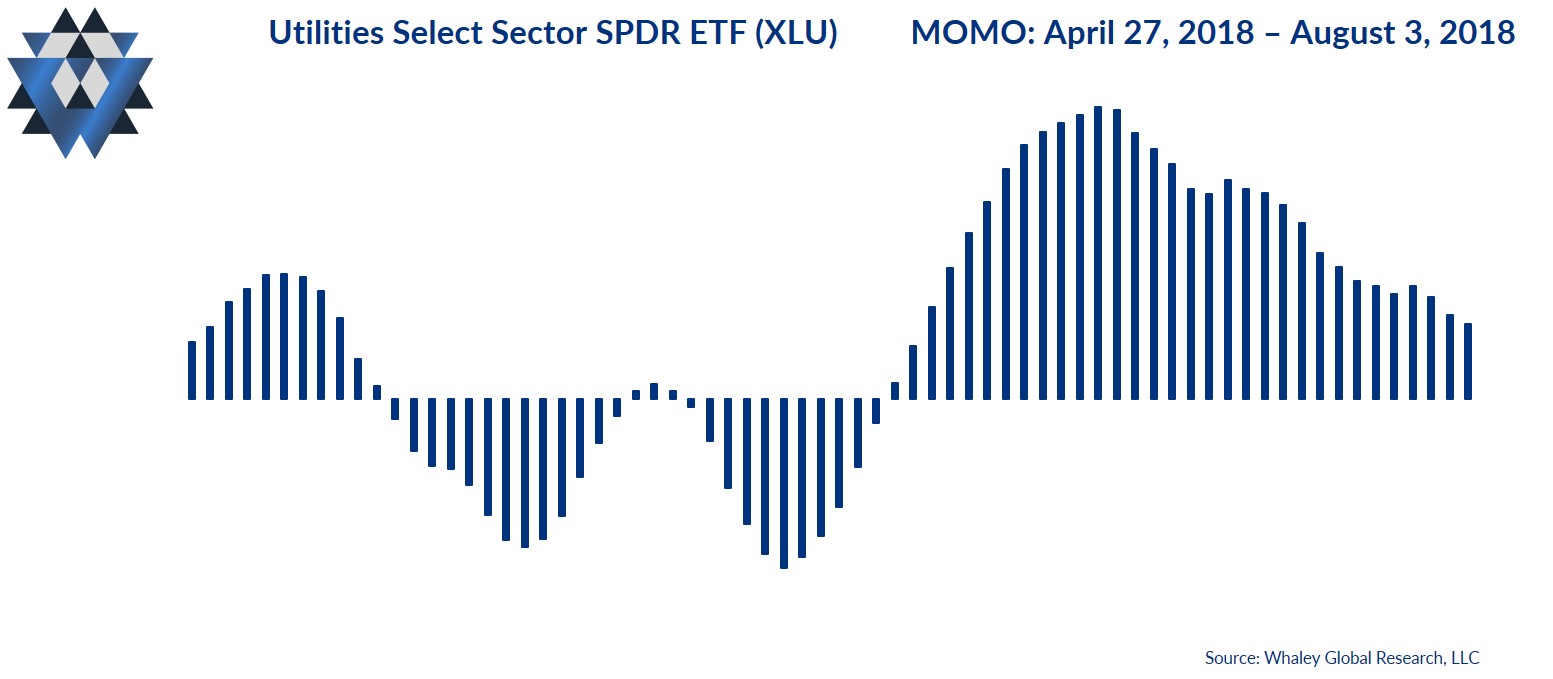
Momo is our measure of the amount of force behind the market’s current state. XLU’s Momo turned bullish on June 20 and has been bullish ever since. The current reading is the most bullish reading since early November 2017.
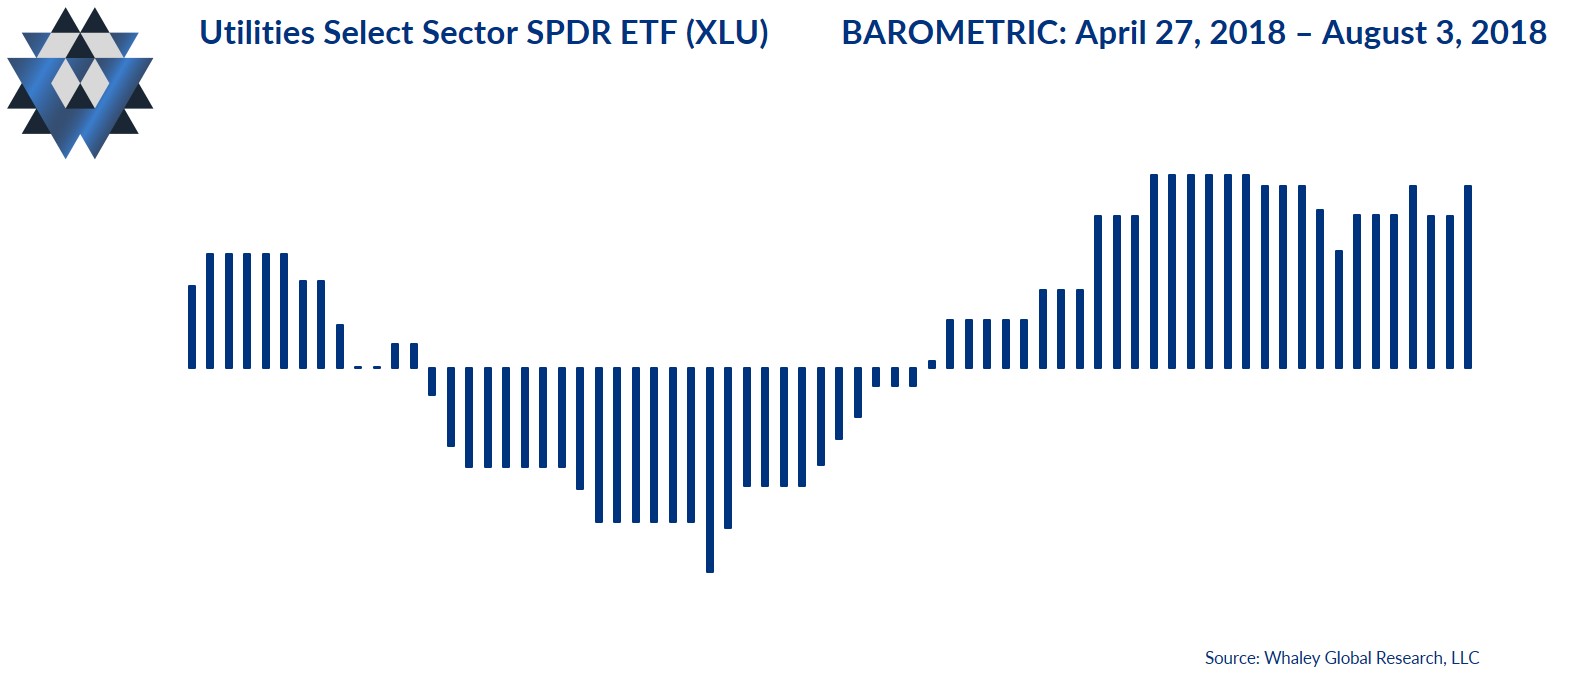
Barometric is our measure of the rate of force behind the current Momo. XLU’s Barometric tells us that buyers remain firmly in control of this market, and that buying pressure continues to build.
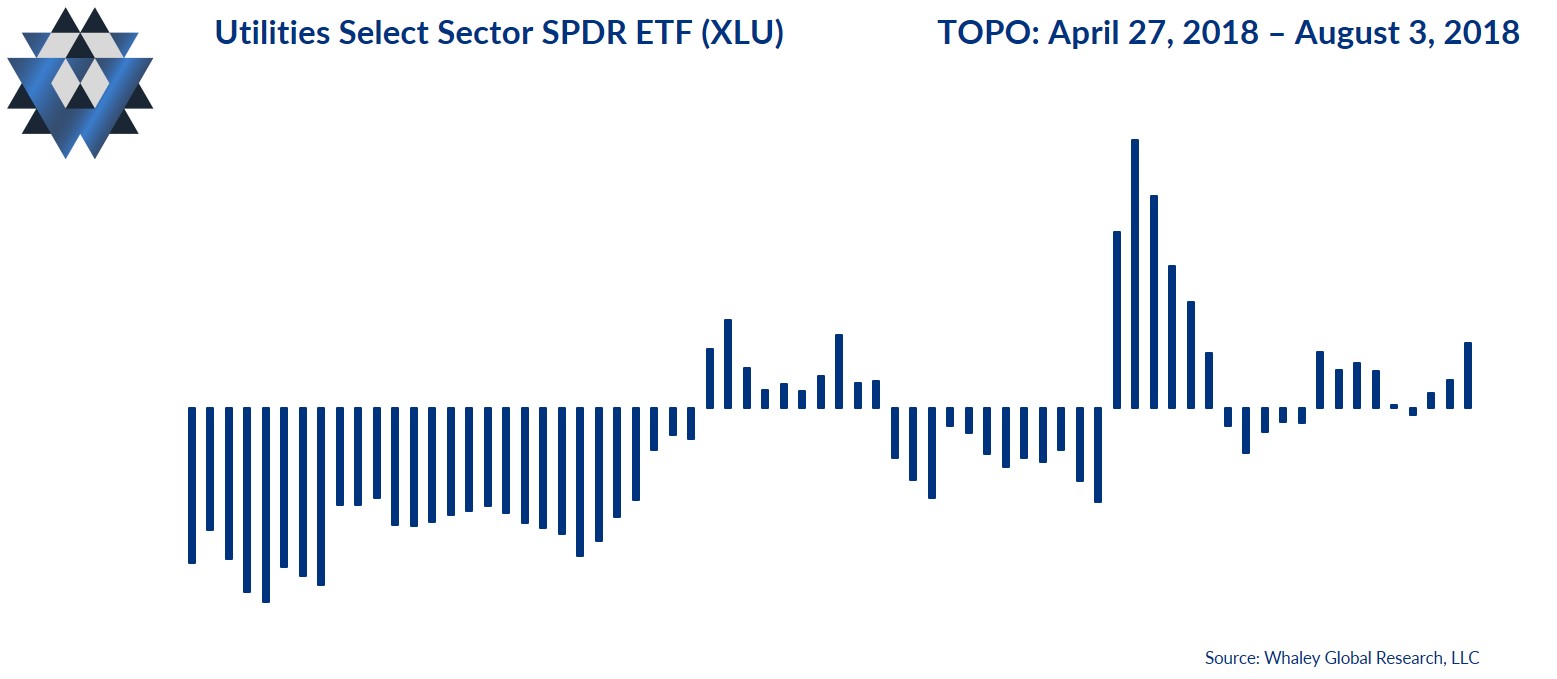
Topo, which measures the probability of a drawdown, is indicating that the drawdown risk for XLU over the next 10 trading days is extremely low.
Most investors are hyper-focused on price action. Unfortunately, price is nothing more than the current point where there are equal parts of disagreement on value and agreement on price. If you’re new to our Quantitative Gravity framework, it’s important to note that the four quantitative dimensions of a market that we monitor typically move ahead of price.
In other words, price is the last aspect of a financial market to move, quantitatively speaking.
However, price is an important factor, and our bullish thesis for U.S. utilities will remain intact, as long as XLU trades above $49.78.
The Quantitative Gravity bottom line is that XLU is firing on all quantitative cylinders right now, and you should be buying pullbacks until further notice.
Behavioral Gravity says what?
Behavioral Gravity allows us to evaluate investors’ perception of this market and how that perception changes and shifts over time.
Since February, investors have added just $97MM to the Utilities Select Sector SPDR ETF (XLU). This amount represents just 1.2% of XLU’s current asset base of $7.8B. While these inflows show that investors are slightly bullish on XLU, they aren’t nearly bullish enough.
The Behavioral Gravity bottom line is that the utilities sector will be one of the best-performing sectors, from both a risk and return perspective, in the second half of the year. Clearly, investors don’t fully understand the U.S. Shift Work macro theme, because they are not nearly bullish enough on utilities.
The Trade Idea
As long as XLU trades above $49.78, new long trade ideas can be initiated opportunistically on pullbacks. Depending on your entry and how much room you want to give this trade idea to move, use a risk price between $51.37 and $49.78. That said, your risk price line in the sand is $49.78. If XLU closes below that price, exit any open trades. If the trade moves in your favor and XLU trades up to the $56.41 area, consider closing some, or all, of your position.
In addition to providing detailed analysis and trade ideas like this commentary on a weekly basis, we also provide real-time email alerts whenever we add, or close, a position in our Asset Allocation model inside our Gravitational Edge report. We are currently long XLU in our Asset Allocation Model.
Please email us at ClientServices@WhaleyGlobalResearch.com if you’d like to participate in a an eight-week free trial of our research offering, which consists of three weekly reports: Gravitational Edge, The 358, and The Weekender.


