

Despite what you heard, there has not been an official (10-year/two-year Treasury spread) yield curve inversion; on besides, a yield curve inversion should be exploited not feared, notes Landon Whaley.
You could’ve played one hell of a drinking game last week, taking a shot every time, you heard the phrase “inverted yield curve.” Let’s peel back the narrative and take a look at what an inversion really means.
First, the spread that inverted was the 10-year Treasury yield minus the three-month yield. The most critical spread to monitor—and the one that is typically cited as a benchmark of the yield curve — is the 10-year Treasury yield minus the two-year Treasury yield, which has been flattening for the better part of six years. The most recent acceleration in that flattening regime began in January 2017, but despite a prolonged descent lower, this spread remains in positive territory—no inversion. In fact, it’s been in a basing formation since the beginning of December, hovering between 0.11 and 0.21.
Recession, or No?
Second, the next thread of misinformation being tossed around about the inverted yield curve is what it means for a U.S. recession. It sounds like every time the yield curve (10s minus 2s) inverts, we experience a recession, and everyone and their mother is predicting that an inversion is soon coming to a Treasury market near you.
What many people don’t understand is that it’s not inversion of the yield curve that one should pay attention to. Instead, it’s the hockey stick in the yield curve (resulting from tightening liquidity conditions) that occurs after the inversion that matters most; check out the “10s minus 2s below.
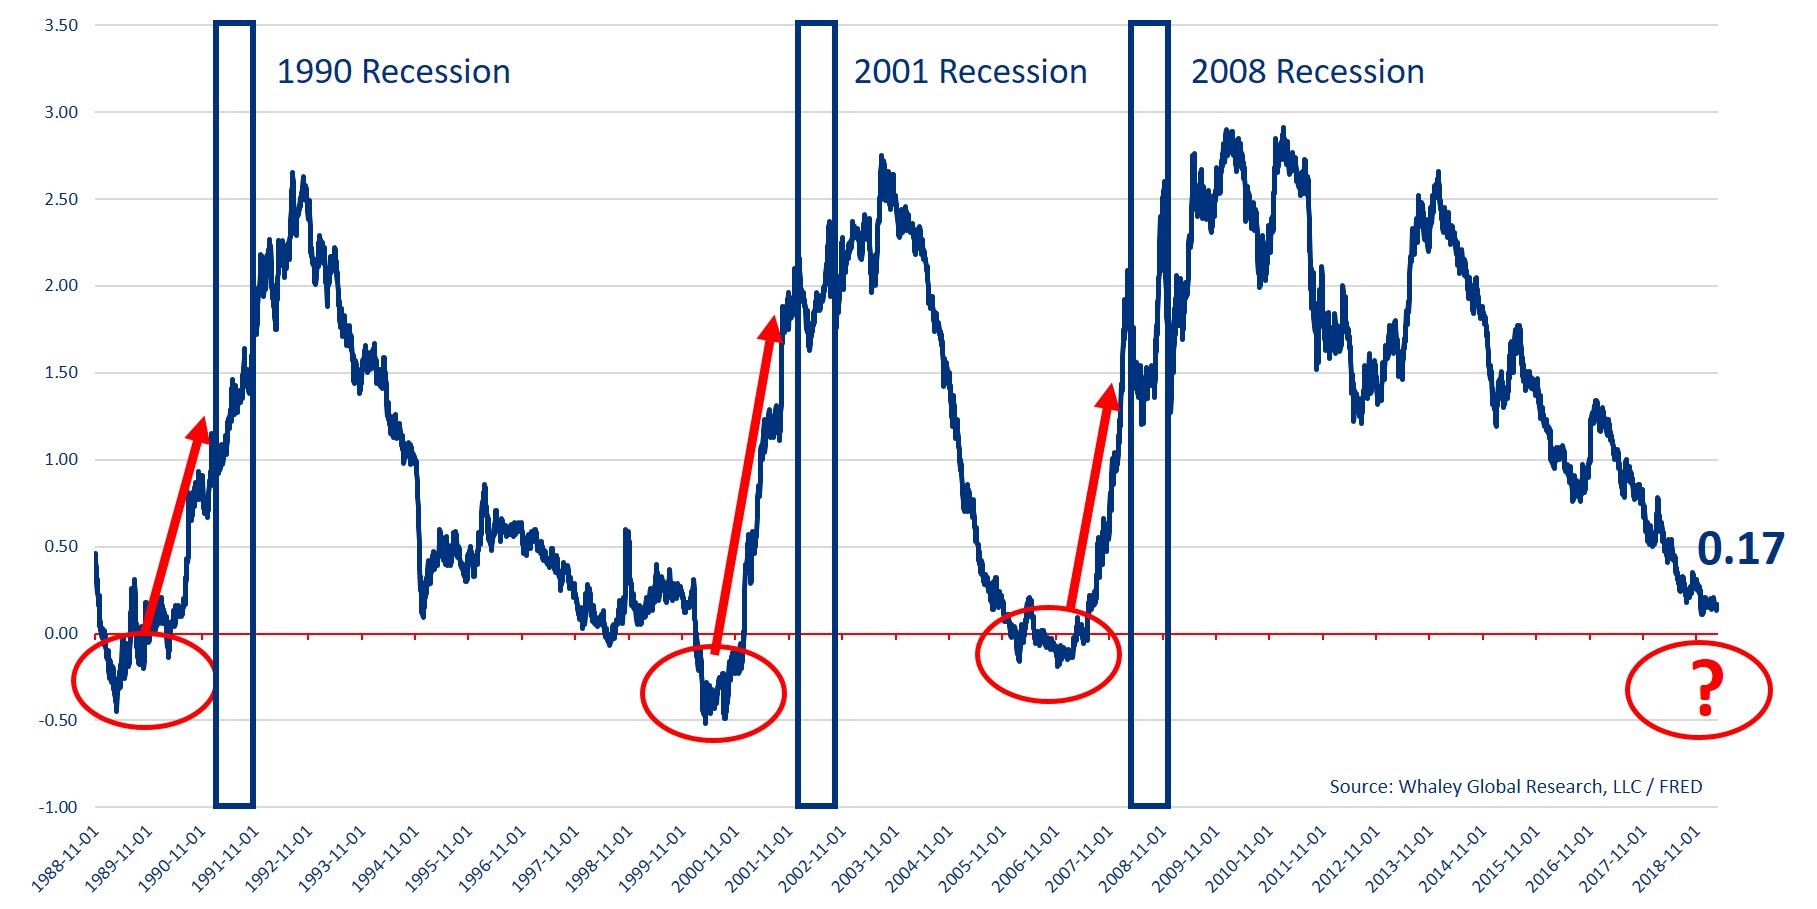
Even if the inversion is a harbinger of recessions, the average time from an inversion in the yield curve to a U.S. recession is longer than “Twin Peaks” was on the air. Since 1988, the yield curve has inverted for a meaningful duration on three separate occasions: December 1988, February 2000 and June 2006. After those three inversions it took an average of 780 days for a U.S. recession to appear. This, of course, is a little misleading as most people feel the affects of a recession prior to officially being declared.
That said, economic data is non-periodic, so you can’t use historical averages to make timing calls but suffice to say that even if the yield curve does invert, you’ve got plenty of time to recession-proof your portfolio.
The Portfolio
The reality of a yield curve inversion is simply that it adds an additional bullish catalyst to markets we already like on the long side because of our U.S. Shift Work macro theme. So, what are those markets, and how have they reacted in the past?
Long-dated U.S. Treasuries
Beginning in 1988, the first yield curve inversion of significant duration lasted six months from December 1988 to June 1989, and long-dated U.S. Treasuries gained +9.6%. The second inversion lasted 10 months from February 2000 to December 2000, and long-dated Treasuries gained +12.1%. The third inversion also lasted 10 months from June 2006 to March 2007, and long-dated Treasuries gained +8.9%.
Not only are the returns more than palatable, but the average peak-to-trough drawdown experienced during these inversions was just -4.1%. With an average gain of +10.1%, the reward-to-risk ratio is more than 2-to-1 in favor of the upside. Isn’t that something you’d be interested in?
Utes
During the 1989 inversion, U.S. utilities gained +13.0% with just a -6.3% drawdown. During the 2000 inversion, utilities gained a whopping +40.8% while experiencing a -16.1% maximum drawdown. And finally, in the 10-month inversion from June 2006 to March 2007, utilities put up a +27.4% gain with just a -5.0% drawdown. With an average gain of +27.1% and an average drawdown of just -9.1%, the reward-to-risk ratio is approximately 3-to-1 in favor of the upside. Utilities are the very definition of “low risk, high reward” when the “concerning” inverted yield curve makes an appearance.
REITs
Treasuries and utilities aren’t the only asset classes that enjoy a good inversion; REITs are bullishly inclined in that environment as well. During the 1989 inversion, U.S. REITs gained +8.3% with just a -0.3% drawdown. During the 2000 inversion, REITs gained a healthy +22.4% while experiencing a -9.9% maximum drawdown. And finally, in the 10-month inversion from 2006 to 2007, they rallied +27.7% with a -12.6% drawdown. With an average gain of +19.5% and an average drawdown of -7.6%, the reward-to-risk ratio is a very tradeable 2.5-to-1 in favor of the upside.
The bottom line is that an inverted yield curve is not something to be feared, it’s something to be harnessed. The U.S. Fundamental Gravity is already conducive to a bullish move in utilities, REITs and Treasuries, which is why utilities and REITs are busting moves to brand new all-time highs and why Treasuries have just hit their own bullish escape velocity. An inversion in the U.S. yield curve is simply going to throw more fuel on the fire.
Please click here and sign up if you’d like to receive April 1 edition of Gravitational Edge, which contains an update for all five macro themes as well as full breakdown for all 14 markets we believe are providing the best opportunities right now, bullish and bearish. By signing up, you will also receive the latest edition our research reports as well as to participate in a four-week free trial of our research offering, which consists of three weekly reports: Gravitational Edge, The 358 and The Weekender.


