

By examining the price curve of Eurodollar futures, traders can discover anomalies in various Treasury product across the curve, points out Paul Cretien.
When we want to know what the U.S. Treasury yields are for six maturity dates – three months, six months, 12 months, two years, five years, and ten years – we look at the data shown by Bloomberg. These yields can be compared with the yields computed for Eurodollar futures to see how accurately the Eurodollar futures yields match U. S.
Treasury yields. The chart below shows the results on Friday, Aug. 16, 2019.
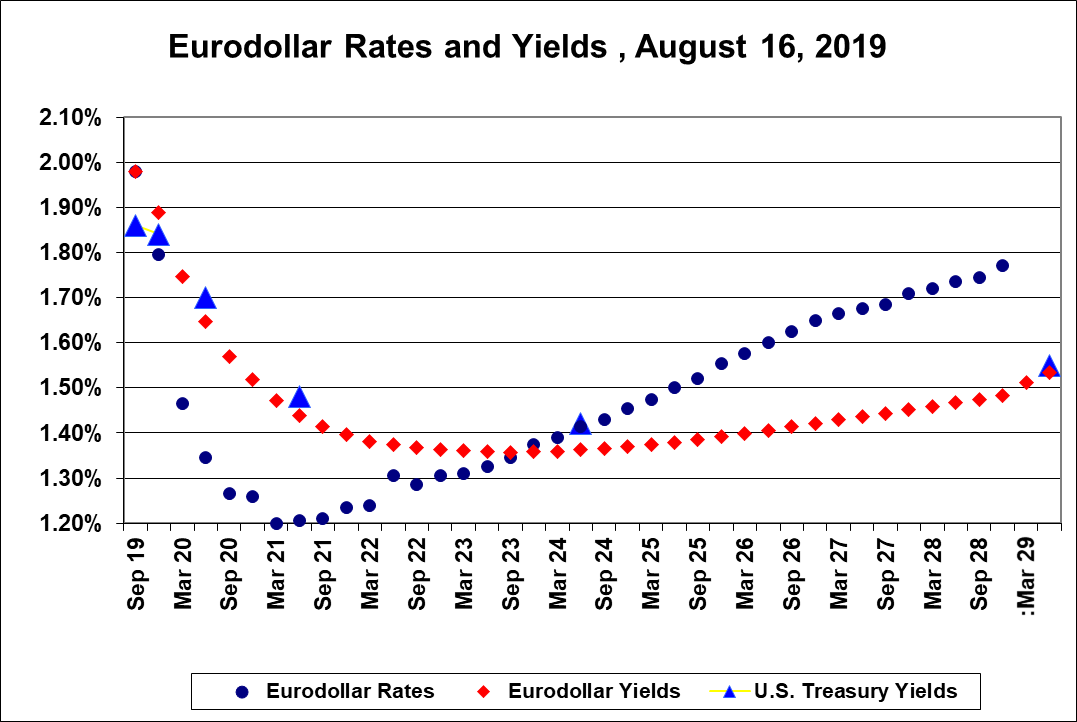
“Eurodollar Rates and Yields Aug. 16, 2019,” shows how closely matched are the Eurodollar and Treasury yield curves. At each maturity listed by Bloomberg for U.S. Treasury yields the Eurodollar yield is within a few hundredths of one percent. This means that we should be able to use the Eurodollar yield curve to estimate all of the missing Treasury yields.
Since there are 40 Eurodollar maturities (every quarter of a year for 10 years) and just six maturities shown by Bloomberg data, this leaves 34 Treasury maturities to be covered by Eurodollar futures yields.
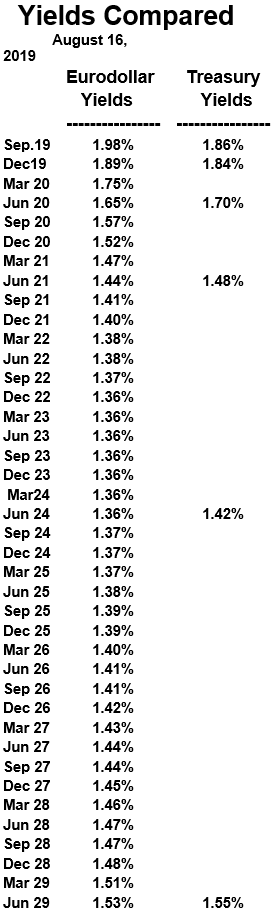
The “Yields Compared” table (below)is a tool that can be used by investors who want to know what the entire U.S. Treasury yield curve looks like – a smooth curve that includes 40 calculated yields computed as geometric means of shorter-term Eurodollar futures quarterly rates.
Using the price table of Eurodollar futures can highlight anomalies in Treasury notes of various durations and suggest potential trading opportunities.


