

Stocks are on the rebound and despite some mixed economic signals, appear ready to make new highs, reports Marvin Appel.
The stock and bond markets have quieted down in the past two weeks after stocks rebounded from their early October losses. The chart below shows that the S&P 500 Index is now retesting its July and September highs in the 3010-3025 range. Concurrently, the Cboe Volatility Index (VIX) dropped sharply from Oct. 8 to 15.
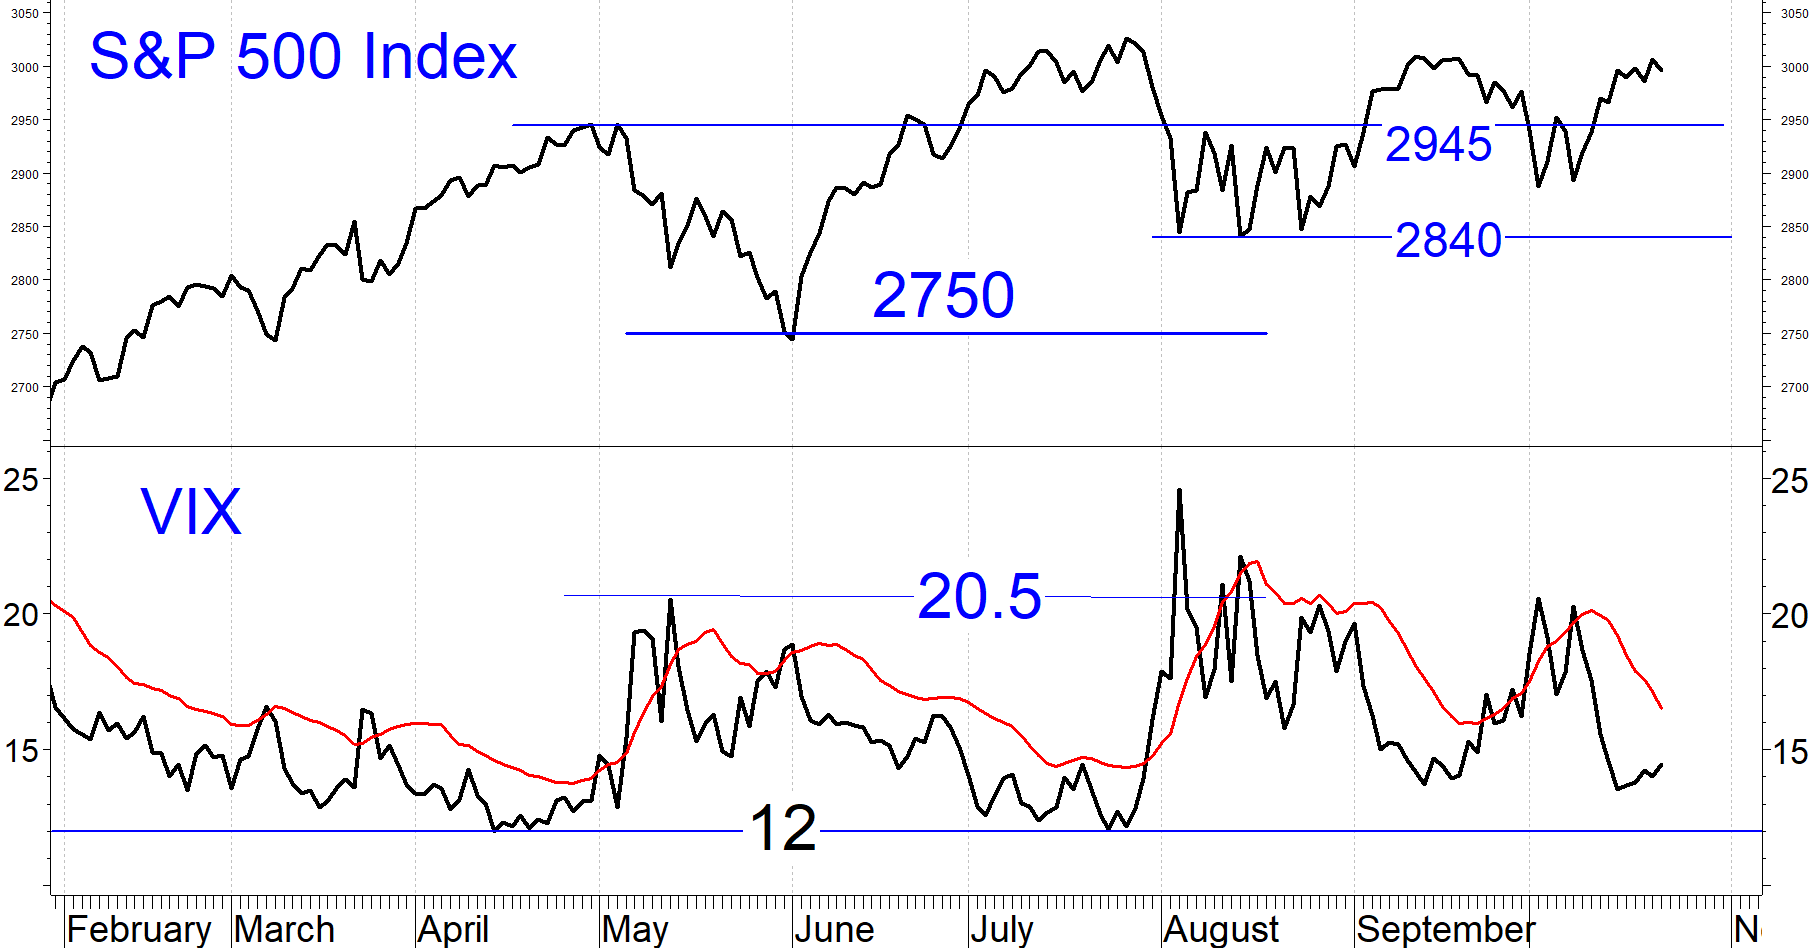
Although anything could happen, with the start of the favorable November-May period around the corner, I expect the index to make a new high or at least hold its ground. Nonetheless, gains are likely to come slowly as stocks are facing economic headwinds. I would be more optimistic, but the market’s signals remain mixed even though they are now moving the right direction.
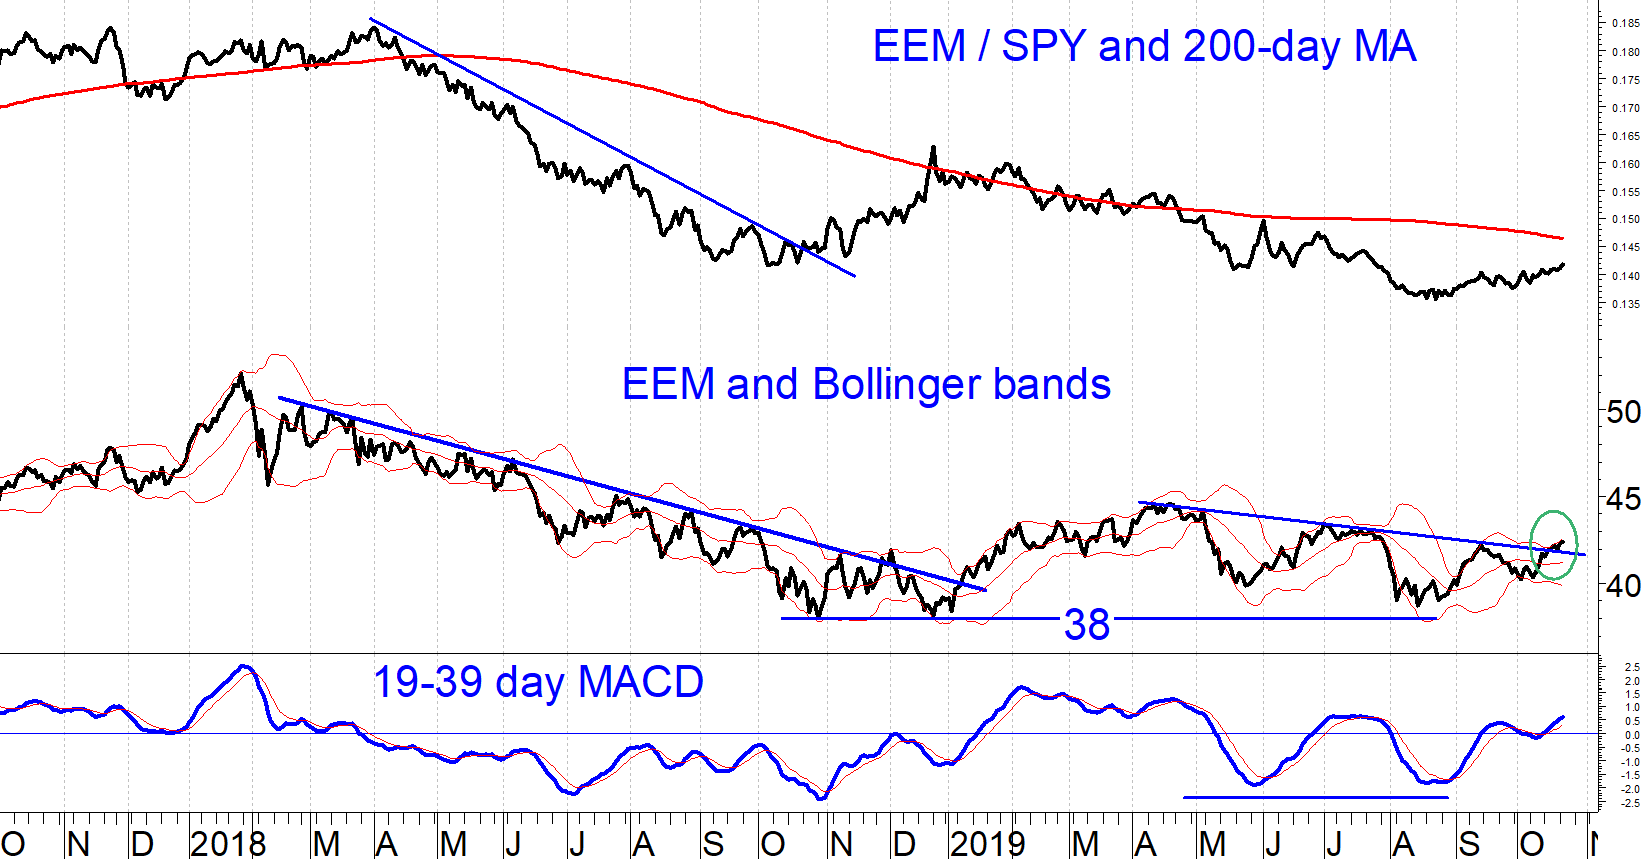
One bright spot is the improvement in emerging markets. The iShares MSCI Emerging Market Index ETF (EEM) has just broken a six-month downtrend (circled in the chart below). Both EEM price and its Moving Average Convergence/Divergence (MACD) indicator have formed bullish rising double bottoms since September. Note in addition that EEM formed a positive divergence with its MACD in May-August when EEM made a new low in August while MACD bottomed out at a higher level than it had in May. I view emerging market stocks as a proxy for trade war prospects with China since more than half of its weighting is in Chinese, South Korean or Taiwanese stocks.
Watch consumer staples (XLP)
The chart below shows the Consumer Staples Sector SPDR (XLP) and the XLP/SPDR S&P 500 ETF Trust (SPY) ratio, along with the slow (19-39-9-day, bottom) MACD of XLP.
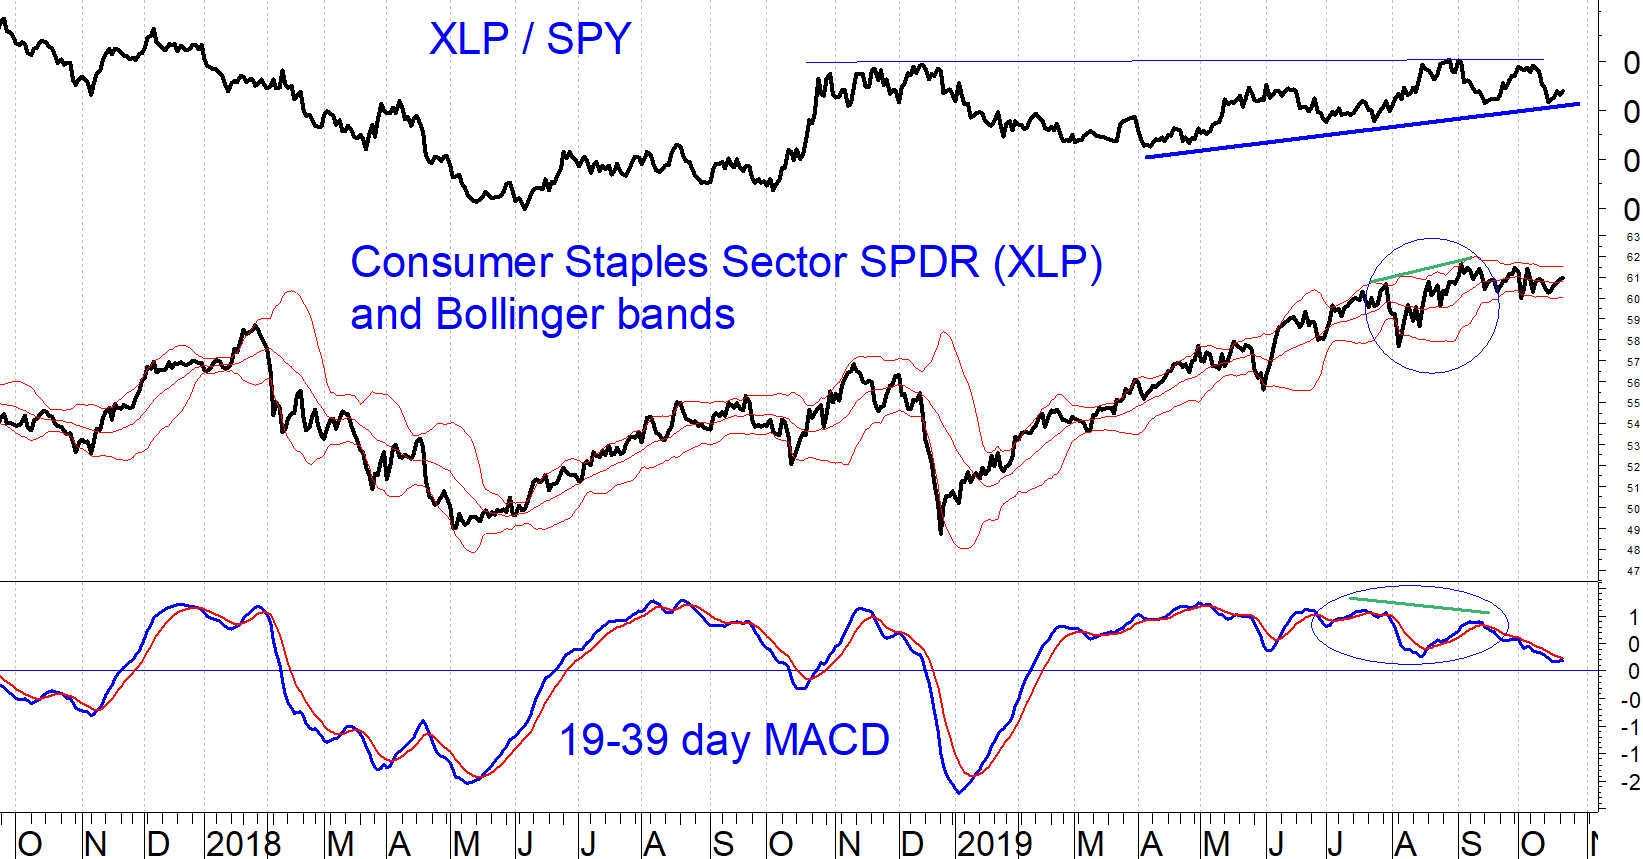
Consumer staples is a defensive sector that usually outperforms in economically uncertain climates because sales in this sector hold up better when the economy slows. As a result, outperformance by consumer staples stocks (that is, XLP/SPY ratio rising) has often been an overall bearish warning sign for the stock market. XLP has outperformed SPY since April, but that trend may have stopped this month. We will keep an eye on this.
Note that XLP formed a bearish negative divergence with its MACD (higher high in XLP in September than in July, but MACD peaked at a higher level in July than in September). Since then, XLP has moved sideways while the S&P 500 has advanced. That is somewhat bullish overall.
Bond markets are giving mixed signals
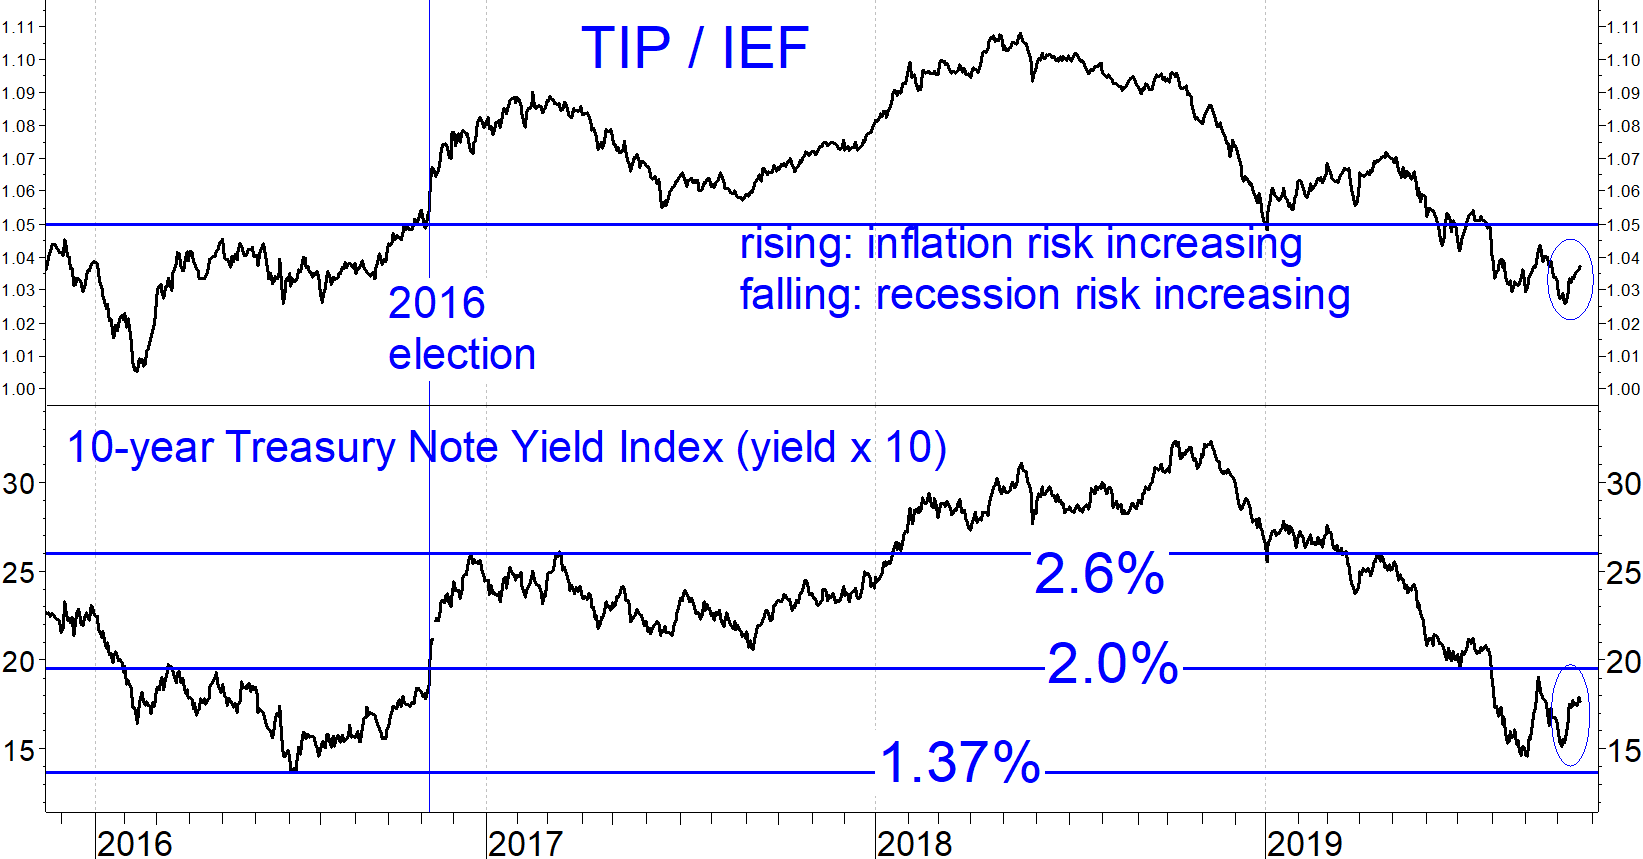
The Treasury market is moving in a bullish direction but interest rates and inflation expectations are still consistent with sluggish economic growth. The chart below shows the ratio between exchange traded funds (ETFs) that track Treasury Inflation-Protected Securities (TIP) and nominal Treasury notes (IEF). When the TIP/IEF ratio is rising it means that investors are willing to pay more for inflation protection. Both the TIP/IEF ratio and 10-year Treasury note yields are recovering from their October lows but are still at the low end of their historical ranges at levels consistent with a sluggish economy.
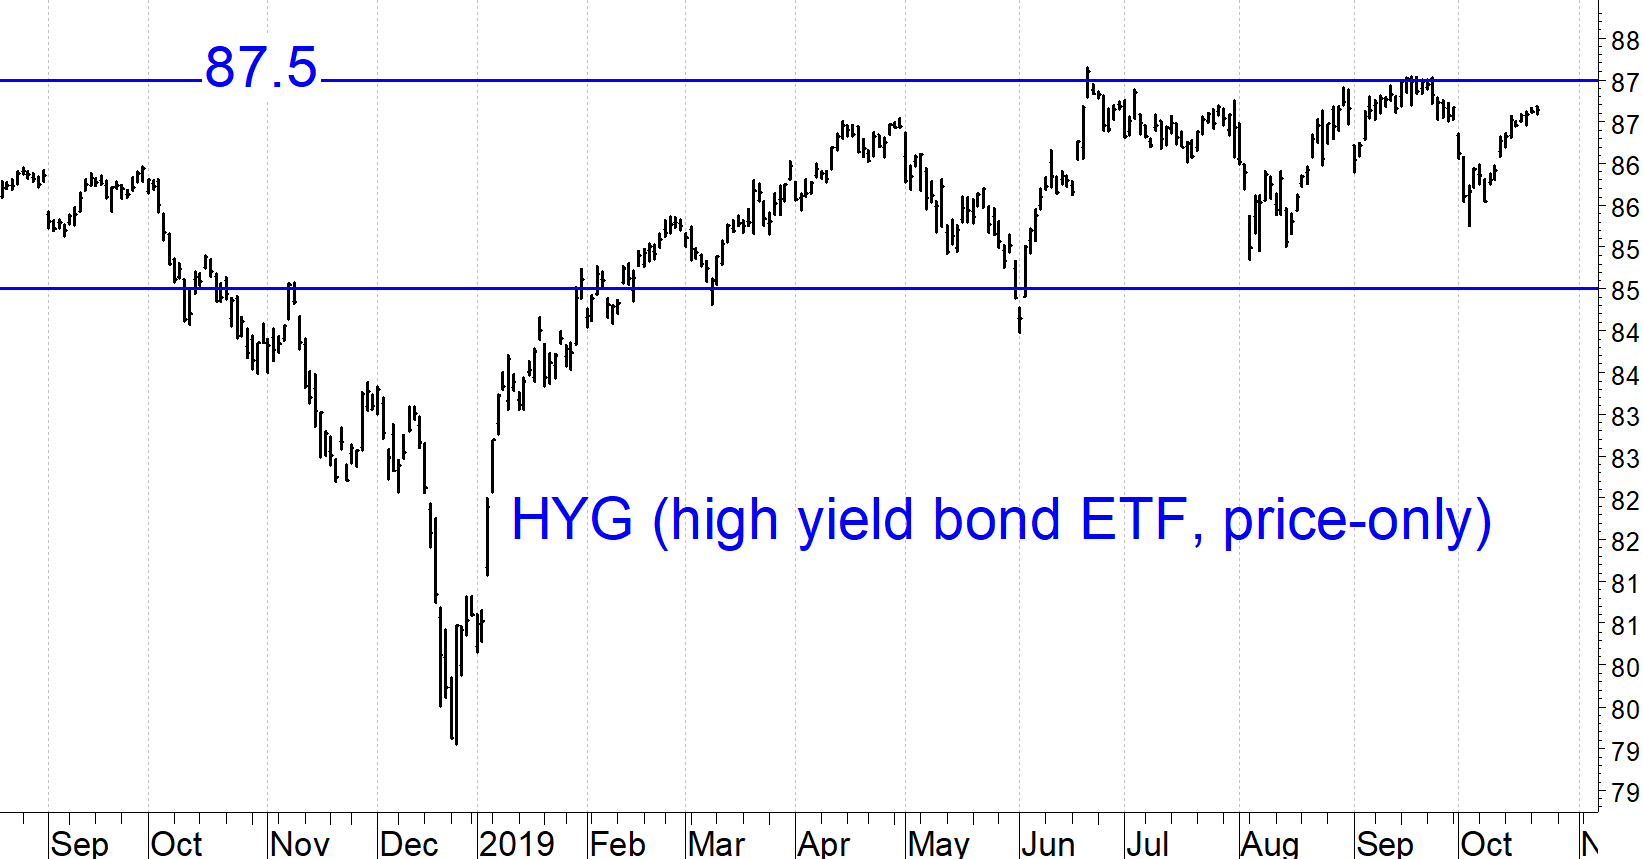
On the bullish side, high yield bonds are holding steady near the upper end of their recent trading range. The iShares iBoxx $ High Yield Corporate Bond ETF (HYG) is doing better than floating rate bond funds, but the latter have at least stopped falling for now (see chart).
Implications
Price trends are sideways, but with high yield bonds holding their ground and favorable seasonality almost upon us, downside risk should remain limited and we should see the S&P 500 make new highs grudgingly. I expect to get a buy signal on our equity model next week, which will lead us to add to positions for clients and for the newsletter portfolio. Don’t be impatient about chasing rallies in the absence of fresh buy signals.
Sign up here for a free three-month subscription to Dr. Marvin Appel’s Systems and Forecasts newsletter, published every other week with hotline access to the most current commentary. No further obligation.


