

Volatility continues to grow spike in GBP as it moves inversely with dollar, reports Joe Perry.
Initial Jobless Claims were released earlier today, and the number was not pretty. Yesterday, we discussed how this number was expected to be larger than any we had ever seen before. According to Bloomberg, the average estimate by economists was 1,500,000 initial jobless claims filed for the week ending March 21. The actual number was 3,283,000. This week’s data shows how badly the economy has been hit by the shutdown from the Coronavirus, as the actual number was more than double the expectations. As this is the timeliest data we have (weekly), this will now be the benchmark going forward. Initial claims greater than this number will be negative for the economy and lower numbers will show that the worst may be behind us. The S&P 500 and US Dollar initially went bid as this data, which suggested how important it is for Congress to pass the stimulus plan to help unemployed workers.
In addition to the initial Jobless Claims data this morning, U.S. Fed Chairman went on the “Today” show earlier noting that we may be in a recession. He also said that the Fed will not run out of ammunition and that he expects economic activity to resume in the second half of the year.
The U.S. Dollar Index (DXY) had been moving lower since yesterday afternoon. While the continued to move lower as Powell mentioned “recession”, it briefly bounced after the initial jobless claims before resuming lower. We wrote yesterday about the technical layout of DXY, which looked as it could be ready to resume its move higher. The pair has since broke lower out of the pennant and US Dollar pairs, such as EUR/USD and GBP/USD have move higher. There is support near the day’s lows at 99.87. A daily close below there could indicate a continued move lower (see chart).
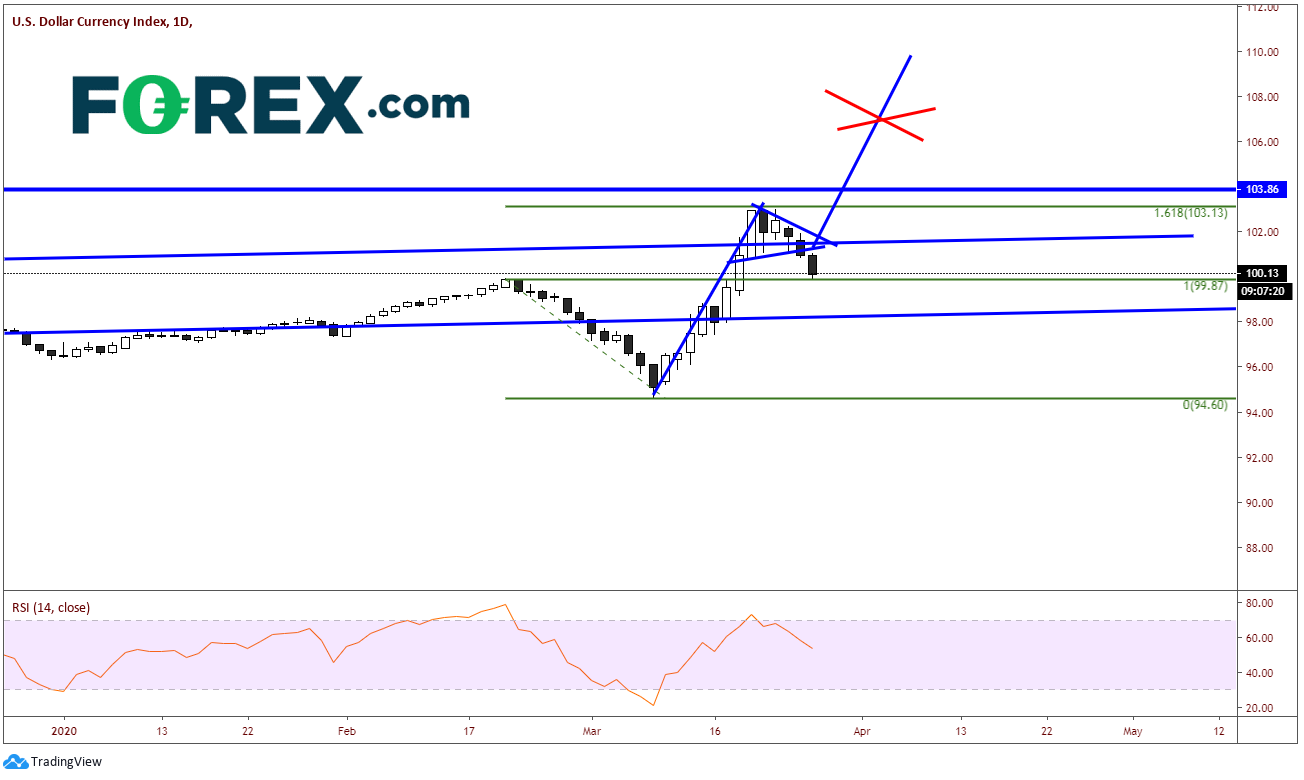
Source: Tradingview, FOREX.com
Fundamentally, the case can be made for the DXY to move higher or lower. The case for a move higher is that because there is such a huge demand for dollars, the price should move higher as more and more funds are needed to keep businesses afloat. On the other hand, the Fed said that they will provide unlimited funding, therefore flooding the markets with dollars. This huge supply should push the value of the DXY lower.
With Powell and the Initial Claims pointing towards “bad” news for the economy, the next item on the agenda will be the vote on the stimulus package. The longer this gets delayed, the worse off those will be who lost their jobs.
GBP/USD in 400 Pip Range!
The British pound (GBP/USD) had a 400-pip range Thursday and was up 2.5% as the Bank of England held their scheduled monetary policy meeting and left rates unchanged. This meeting comes only days after the BOE had two emergency rate cuts and slashed rates to its lowest rate ever. The BOE in recent days also began a 200 billion pound Quantitative Easing (QE) program and said they are ready to do more if necessary. The Great British Pound continued its bid on the European open from yesterday’s intraday low of near 1.1650. In addition, the US Dollar has been getting pummeled all day, down 1.5%, pushing the GBP higher vs the US Dollar.
On March 9th, GBP/USD put in a high of 1.3200 and began trading lower as it seemed Boris Johnson was not yet 100% ready to deal with the coronavirus pandemic. Also, at that time, the dollar became a flight to safety as stock markets around the world began to selloff. On March 20, the pair out in a low of 1.1410 as the BOE cut rates to 0.1% and the DXY was topping. On the chart below, the bottom portion shows the correlation between the GBP and the DXY. Before the pound peaked on Feb. 20, the pair broke its normal behavior and the correlation was positive. Once price peaked, the correlation coefficient stated moving lower and is currently at -0.97, meaning that the GBP and the USD move are currently moving in opposite directions 97% of the time.
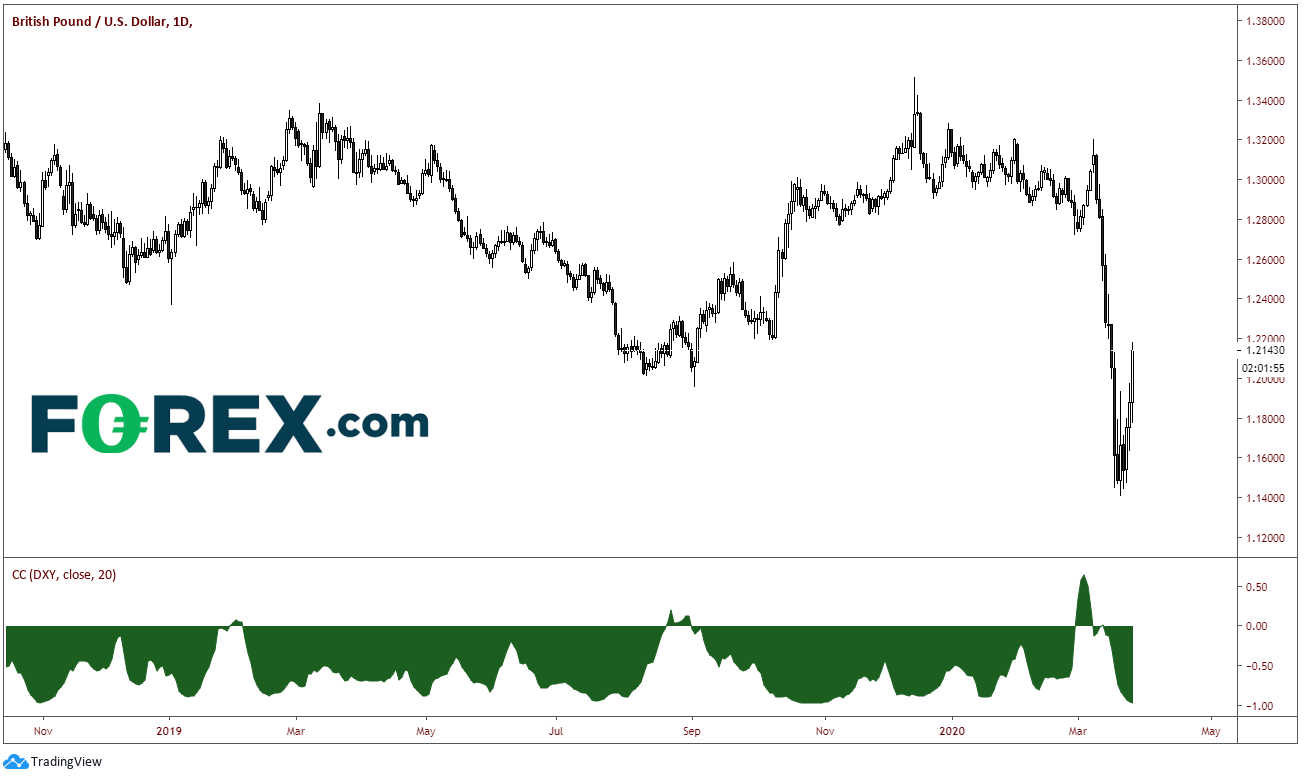
Source: Tradingview, FOREX.com
Today’s move in GBP/USD was monstrous. Price broke higher through a large resistance band between 1.1860 and 1.2000. In addition, the pair broke through the 38.2% Fibonacci retracement level from the highs on Feb. 20 to the lows on March 9 near 1.2093. There is strong horizontal resistance just above 1.2200. Above there is a small band of intraday resistance and the 50% retracement level from the same time period between 1.2275 and 1.2305. The next resistance level is nearly 200 pips higher at the 61.8% Fibonacci retracement level near 1.2516 (see chart).
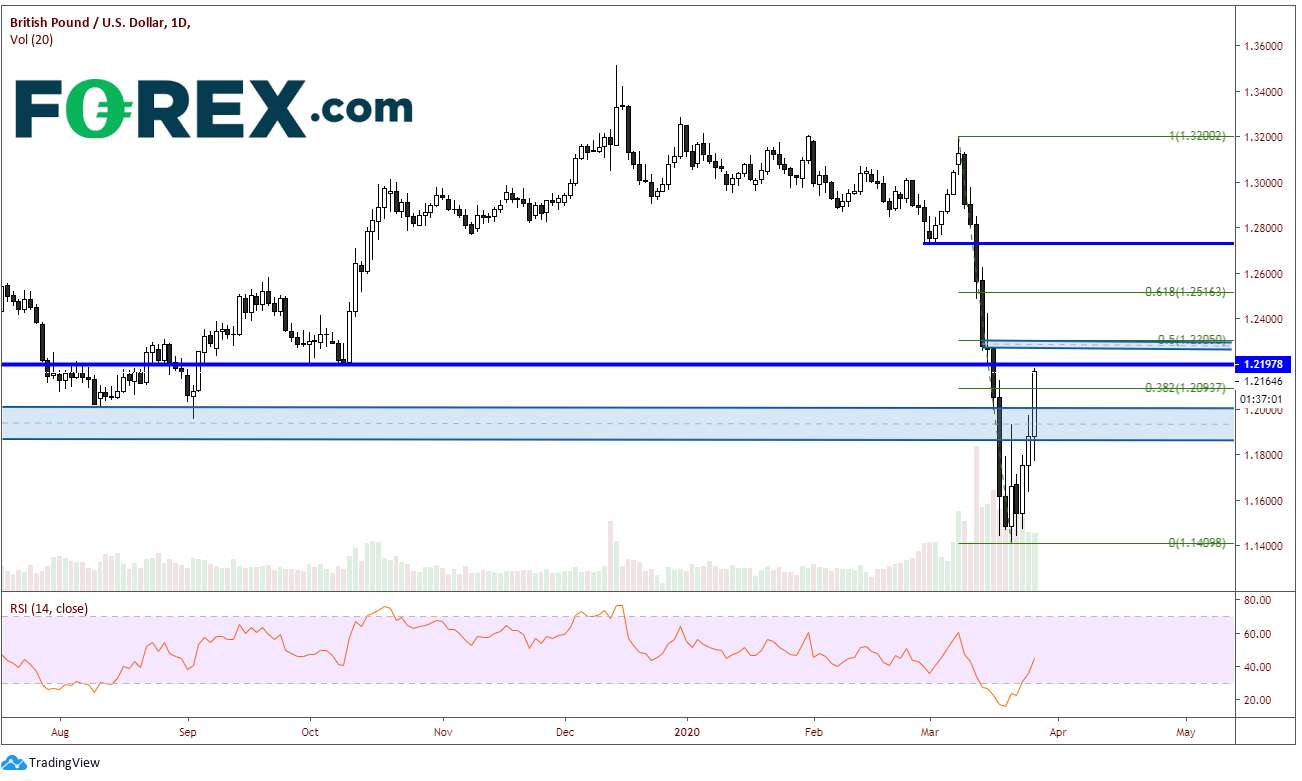
Source: Tradingview, FOREX.com
As for support, there really isn’t much until the psychological round number at 1.2000. Below that is the previous band of resistance between down to 1.1860. There is also horizontal support near 1.1640. The final support level is the low from March 20th at 1.1410.
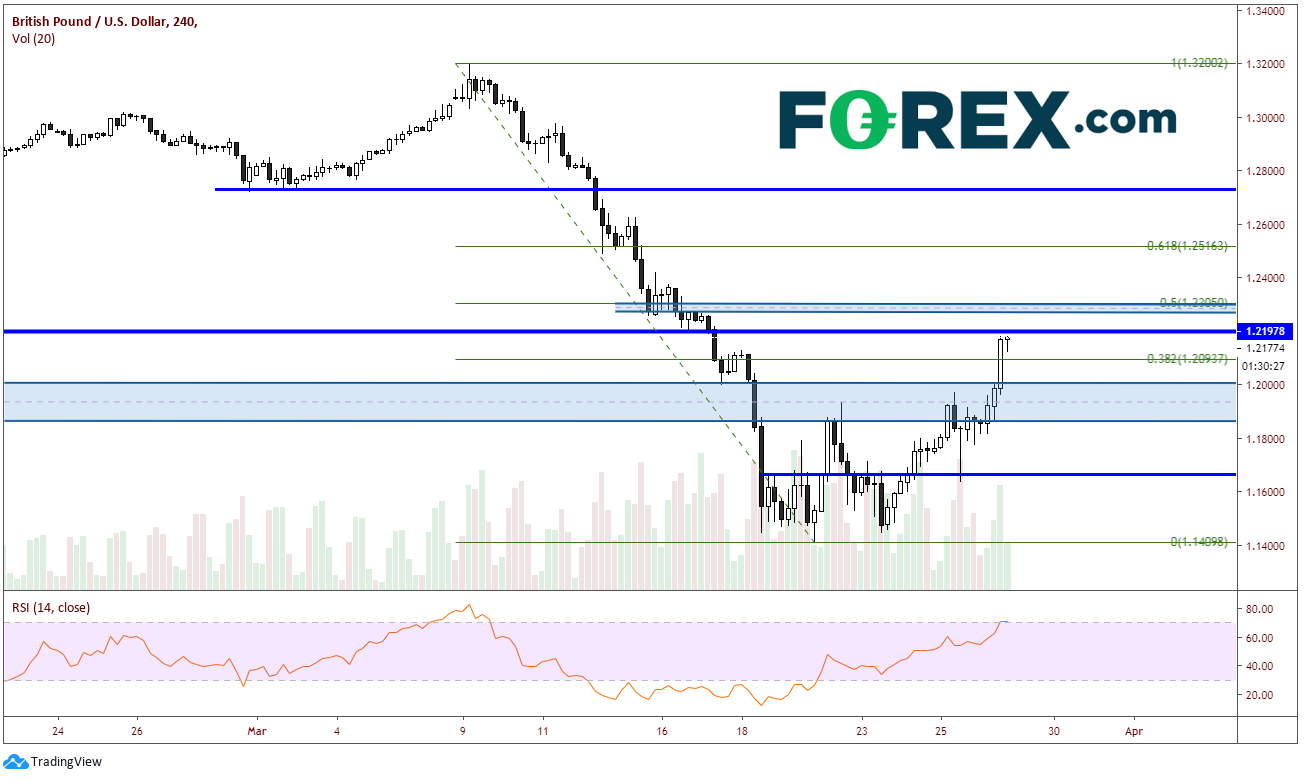
Source: Tradingview, FOREX.com
If traders dare to enter a GBP/USD position, be ready for volatility and some massive moves. Make sure to watch for sudden changes in the DXY as well, as these two currencies are almost perfectly negatively correlated.
Joe Perry holds the Chartered Market Technician (CMT) designation and has 20 years of experience in the FX and commodities arenas. Perry uses a combination of technical, macro, and fundamental analysis to provide market insights. He traded spot market FX and commodity futures for 17 years at SAC Capital Advisors and Point 72 Asset Management. Don’t forget that you can now follow Forex.com’s research team on Twitter: http://twitter.com/FOREXcom and you can find more of FOREX.com’s research at https://www.forex.com/en-us/market-analysis/latest-research/.


