

Alan Ellman explains how to employ technical analysis for options strike selection.
Strike price selection is the second required skill for our covered call writing and put-selling portfolios. Stock and exchange trade fund (ETF) selection and position management (exit strategies) are the other two. This article will highlight how we can use overall market assessment and price chart analysis to help guide us to the best strike price selections.
Overall market assessment as of Jan. 10, 020 (prior to the current coronavirus crisis)
General Market Index: 5/6
Investor Business daily: Market in confirmed uptrend
S&P 500/VIX Comparison Chart:
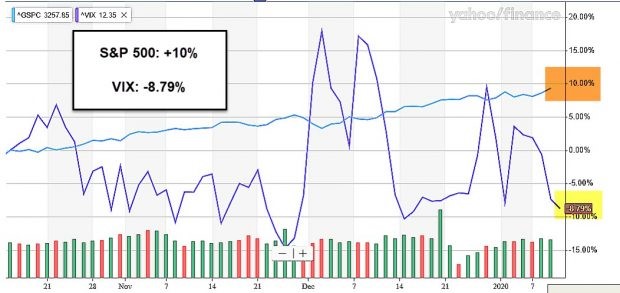
Bullish S&P 500 and VIX Comparison Chart as of 1/10/2020
Combining Dr. Eric Wish’s GMI, IBD’s market analysis and the comparison chart, it is reasonable to move into our trades with a bullish bias. That leaves individual chart analysis to dictate final decisions regarding moneyness and laddering composition (percent in-the-money and out-of-the-money) of our strikes.
Bullish price charts favor out-of-the-money (OTM) call strikes: Boot Barn Holdings Inc. (NYSE: BOOT)
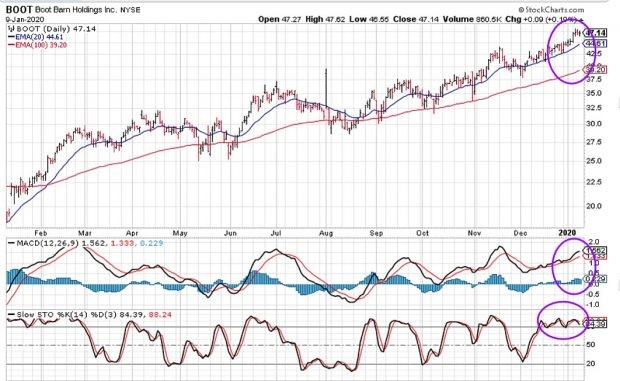
BOOT: Bullish Chart as of Jan. 10, 2020
The purple highlighted areas show:
- Bullish moving averages
- Bullish MACD histogram
- Bullish stochastic oscillator
Mixed price charts favor in-the-money (ITM) call strikes: Teleflex Inc. (TFX)
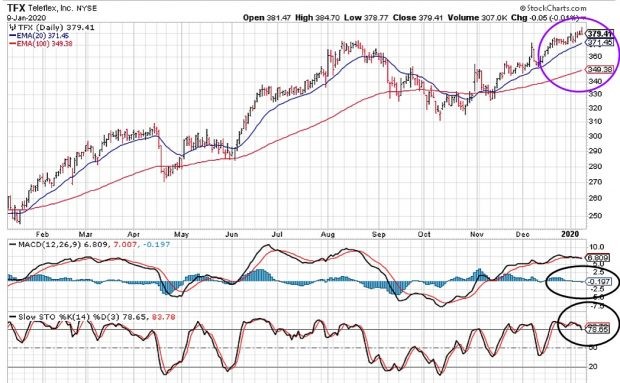
TFX: Mixed Chart as of Jan. 10, 020
- Purple highlighted area shows bullish moving averages
- Black highlighted areas show bearish MACD histogram (slightly below “0”)
- Black highlighted area (bottom) shows the stochastic oscillator recently moving below the 80%, a bearish signal
Favoring ITM or out-of-the-money (OTM) strikes can result in all or a higher percentage of each strike type. For example, if we are selling three contracts with a specific stock and are bullish, we can sell 2 or 3 OTM strikes. For a bearish bias, we may go with two or three ITM strikes. We do so by checking an option-chain and, after determining the moneyness of the option, selecting the strike that generates our stated initial time-value return goal range.
Discussion
Strike price selection is based on overall market assessment, technical analysis and personal risk-tolerance and goals. This article highlights how the first two of these parameters will help guide us to the most appropriate option strike prices.
Use the multiple tab of the Ellman Calculator to calculate initial option returns (ROO), upside potential (for out-of-the-money strikes) and downside protection (for in-the-money strikes). The breakeven price point is also calculated. For more information on the PCP strategy and put-selling trade management click here and here.


