

While there are signs that the dollar may be ready to reverse from its bearish trend, long-term cycles indicates it could be very long before sees new highs, reports Ashraf Laidi.
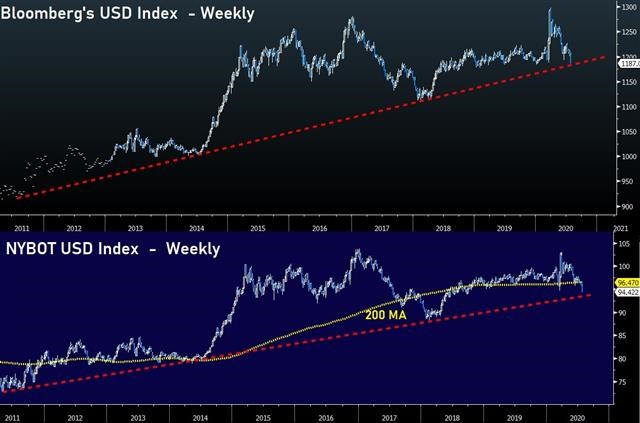
Below are two charts for the U.S. Dollar Index (see below) that seem to suggest that the U.S. Dollar Index may be near a turning point in its four-month decline. Before you come to a conclusion, see the third chart at the bottom of this piece.
You know the U.S. dollar has a problem when it's posting its biggest weekly decline in four months on the same week that S&P 500 is having its worst week in over a month. But let's look ahead: Will USD bulls finally see some light at the end of the four-month tunnel? The two charts suggest the dollar stabilization/bounce could start as early as next week. But what's beyond that?
One USD-positive narrative anticipates that macro damage in and out of the United States will re-ignite fresh wave of equity selling, prompting the usual dollar-demand. One negative narrative for the dollar is that the Federal Reserve—which has already reduced its asset purchases over the last four weeks-could easily crank up liquidity and put off any dollar-risk aversion fire.
We could also mention surging Eurozone portfolio flows, but we'll stay here all day/night arguing. So, let's cut it short and mention some technical signposts, leaving you with this once-in-a-lifetime chart (see below).
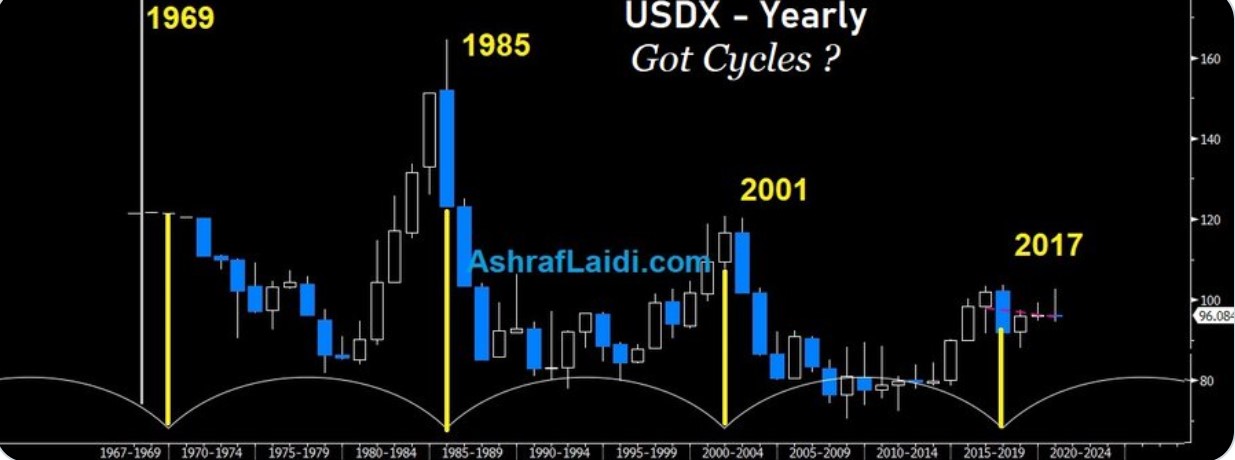
As you can see from this yearly U.S. Dollar Index chart, the dollar tends to have long-term cycles. It tends to move in 16-year cycles. The dollar peaked in 1969, 1985, 2001 and again in 2017. This would indicate that the 2017 top could be with us until 2033!
You can see Ashraf’s daily analysis at www.AshrafLaidi.com and sign up for the Premium Insights. Ashraf discussed Trends in Yield Differentials at the TradersEXPO New York on March 8.


