

As expected, the Federal Reserve announced that it will begin tapering its purchases of Treasury and mortgage-backed securities, scheduled to wind down after eight months, explains Marvin Appel of Signalert Asset Management.
Fortunately, federal borrowing will be falling as well, so the net supply of Treasuries won’t change that much during the course of the taper. Meanwhile, payroll processor ADP announced that they estimate that private sector employment increased last month by 573,000, which is a very strong number.
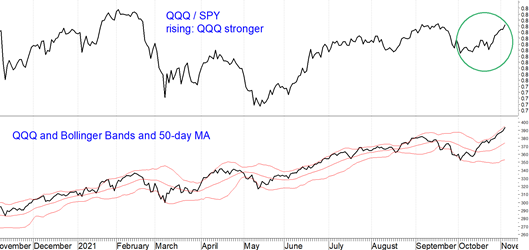
Stocks liked what they heard, advancing steadily after the FOMC announcement. However, we are getting conflicting signals regarding the economy. The Nasdaq 100 ETF (QQQ) has been outperforming the S&P 500 in recent weeks (circled in the chart below.) Since the pandemic, outperformance by QQQ has occurred in the setting of stable or falling interest rates and expectations of a slowing economy. Relative weakness in industrials (XLI) confirms a cautious economic outlook. On the other hand, transportation stocks (IYT), another sector that, like industrials, is sensitive to the expected rate of economic growth, have been outperforming the S&P 500 SPDR (SPY).
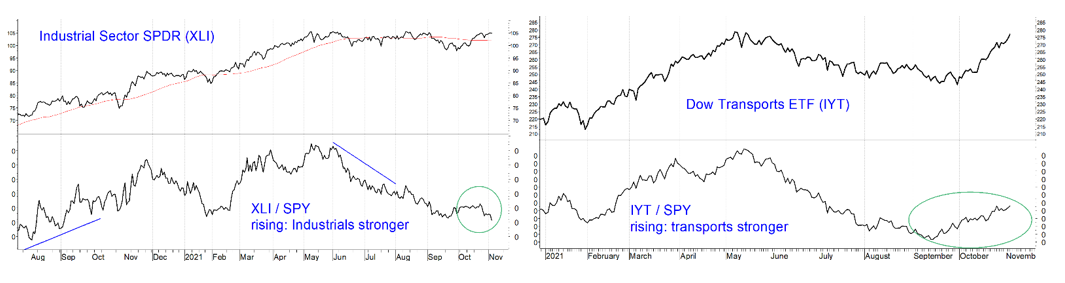
Figures: Industrial Sector SPDR (XLI, above left) and Dow Jones Transportation Average ETF (IYT, above right.) The ratios of these ETFs to the S&P 500 SPDR (SPY) shows the performance of the sector ETFs, relative to the S&P 500. When the ratio is rising, it means the sector ETF is stronger than the overall stock market. Industrials have lagged since October 22 (circled in green), a sign of economic pessimism. On the other hand, transports have outperformed the market since September 14 (also circled in green), a sign of growth.
Interest rates are also giving mixed signals. Even though five-year inflation expectations hit a new multi-year high recently (see orange line in the chart below), the yield on 10-year Treasury notes has fallen since the October 21 peak of 1.67%, which itself remained below the March 31 peak of 1.75%.
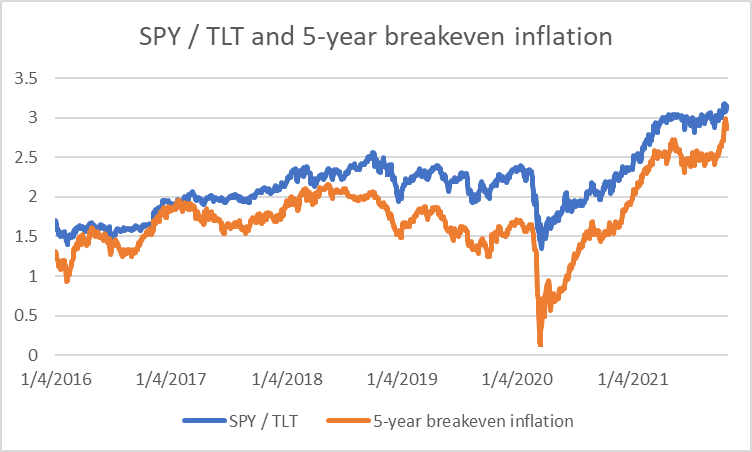
Figure: SPY / TLT ratio and five-year inflation expectations, as implied by the yield spread between 5-year TIPS and 5-year Treasury notes. TLT is the iShares long-term Treasury ETF. (SPY and TLT data are total return from FastTrack. The chart is based on a concept from John Authers on Bloomberg.com.)
The chart on the bottom of page two also shows the ratio between the S&P 500 SPDR (SPY) and the iShares 20+ year Treasury bond ETF (TLT). When this ratio is rising, it means that stocks are outperforming long-term Treasuries. Since 2016 (but not necessarily earlier), rising inflation expectations have occurred during periods when stocks outperformed long-term Treasuries. That means that the recent spike in inflation expectations should be near-term bullish for stocks if it persists.
However, I think there is a good chance that inflation will stabilize, or even abate. With the exception of energy, commodity prices have been flat or declining since May (see chart below.) A strong employment report tomorrow would be paradoxically disinflationary. Job openings have been climbing rapidly all year (see chart at bottom from the Bureau of Labor Statistics 1), so the past two months of weak employment growth represented a pro-inflationary labor shortage. This is due to people being uninterested in working, rather than the weak demand for labor.
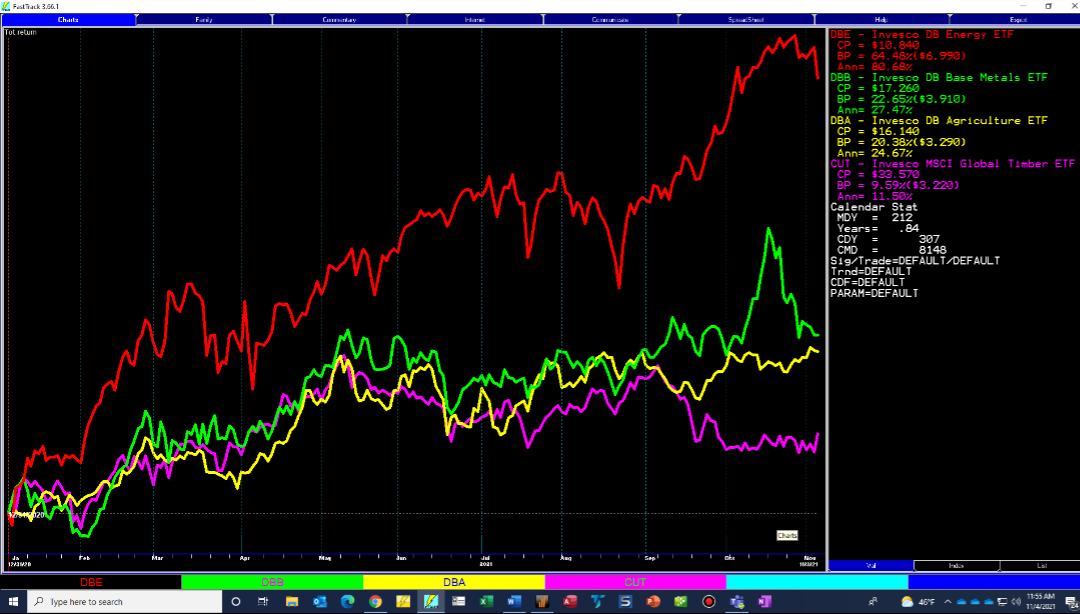
Figure: Commodity-related ETFS in 2021 year-to-date. Energy (DBE, red) peaked on October 26, and has since pulled back 4.7%. Industrial metals (DBB, green), agricultural commodities (DBA, yellow) and timber (CUT, purple) are little changed since May 9-11.
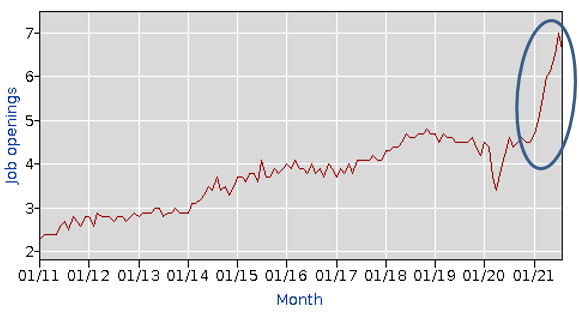
Figure: Job openings in the US, 2011-2021 (millions). Note the unusually rapid rise in available jobs that has occurred this year (circled).
Implications
Contrary to my cautious outlook, the US stock market remains in a strong near-term uptrend. (Foreign stocks are making new relative strength lows relative to the US and you should continue to underweight them, or avoid them entirely.) Investor sentiment is so strongly bullish as to be a near-term cautionary signal based on its history as a contrarian indicator. I remain reluctant to add to positions here, except in the form of a covered call position, because I continue to believe that all the good news has been priced in.
Although there may be reasons to expect value to outperform over the long term (see next article), in the near term, the stability of long-term interest rates is favoring growth over value. At the very least, if you are looking to make a bet on value, I would delay adding to value for as long as our investment-grade bond model remains on its July 7th buy signal. However, my longstanding preference is not to overweight either growth or value.
Our plan for clients is to add to equity positions when our equity model switches from “hold” to “buy.” Until then, we will stay the course.
To learn more about Marvin Appel, please visit Signalert Asset Management.
1 https://data.bls.gov/timeseries/, accessed 11/4/2021


