

Stocks have sold off in the past week. The first hit occurred on the normally quiet day after Thanksgiving, when news about the omicron Covid variant broke, states Marvin Appel of Signalert Asset Management.
The second hit occurred on November 30, when Fed chairman Powell broached the idea of tapering the Fed’s quantitative easing more quickly in response to inflation. Yesterday, the S&P 500 Index (SPX) was up by some 2% before giving it all back and more by the close, after a case of the omicron strain was reported in California.
Ironically, Powell’s newfound respect for inflation seems to have occurred after expectations peaked. Five-year TIPS breakeven inflation peaked on November 15 at 3.17% and fell to 2.8% Wednesday. Better late than never. I hope that omicron doesn’t turn out to be a big economic drag because if it does, the Fed will turn out to be zigging when they should be zagging. We should know more over the next two to four weeks about how much threat omicron is posing. At the very least, I expect we will need recurring booster shots for years to come.
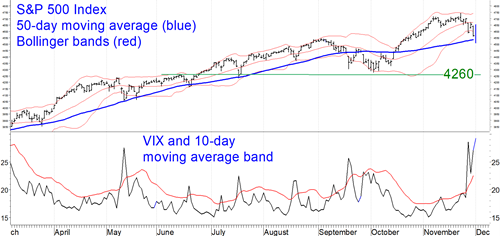
The chart above shows that the S&P 500 is at near-term support from its 50-day moving average. Also, stocks are oversold, as judged by the CBOE SPX Volatility Index (VIX) being above its 10-day upper moving average band.
Since the start of 2021, stocks had it good on two fronts. On the one hand, inflation was increasing, spurring growth in corporate earnings. On the other hand, the Fed didn’t react and instead maintained its highly stimulative policies. Now, both of these tailwinds are poised to reverse: The Fed is at last waking up to inflation, while Covid looms as a greater threat to the economy than at any time this year.
As a result, despite the likelihood that the S&P 500 will hold near current levels for now, it appears to me that downside risk appears greater than upside potential over the next two months. I would not be surprised to see our equity model switch to a sell signal in one or two weeks. In the event of an intermediate-term decline, support for the S&P 500 Index should lie in the 4250-4300 range (the chart shows 4260), representing a 9% decline from the November peak to retest of the July 19 and October 4 lows. Below that, the next downside objective would be 3950-3975 (18% correction) from where the S&P 500 broke out in April.
To learn more about Marvin Appel, please visit Signalert Asset Management.


