

The S&P 500 Index undercut its January 10 intra-day low today, bringing its January loss to 4.9%, which more than reverses December’s gains. The Nasdaq Composite has borne the brunt of the losses, now down more than 8% in January, as is the iShares S&P large-cap growth index ETF (IVW). Meanwhile, the iShares large-cap value index ETF (IVE) is down just 1%, says Marvin Appel of Signalert Asset Management.
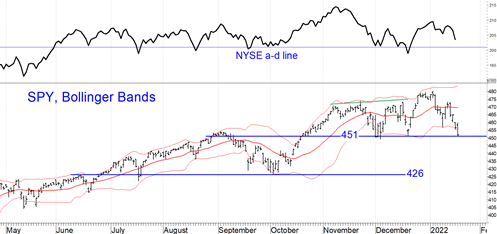
The chart below shows how the S&P 500 SPDR (SPY) closed at the 451 support level for the third time since early December. If you are looking for good news, the NYSE advance-decline line remains above its December lows, reflecting that the current leg down has been led by relatively few of the largest growth companies. Today’s close in the S&P 500 Index option implied volatility (VIX) of 23.8 is a near-term oversold condition for the market, suggesting that this support area should hold for at least a week. However, with our equity model on a sell I expect that intermediate-term risk for the first half of 2022 is more to the downside than to the upside. In particular, I expect to see a test of 426 for SPY in the coming months.
This is the first time since 2018 that the Federal Reserve is in tightening mode, and the first time since the early 1990s that it has had to deal with already-high inflation exceeding 4% in a calendar year. As a result, investors will have to deal with a Fed more unfavorable for stocks than we have seen in a generation. Buying every dip may no longer be a foolproof strategy.
As discussed in this issue, several factors favor value overgrowth for 2022. These include the strength of the US dollar, rising earnings, and the observation that the value/growth ratio is very oversold. Other strategies for this environment include covered call writing. Foreign stocks are worth keeping an eye on as well. (I will discuss these in part two of the equity outlook in the next issue.)
Rising Interest Rates Have Already Taken a Toll in 2022
Normally one thinks of Treasuries as safe investments and corporate high-yield bonds (sometimes called junk bonds) as risky. But during periods of rising interest rates, it is often junk bonds that are safer. Year-to-date, 10-year Treasury note yields have risen from 1.62% to 1.87%. The benchmark Vanguard Total Bond Market Index Fund (VBMFX) is down 2.4%, while the high-yield bond benchmark High Yield Master II Index is down 1.2%. The S&P Municipal Bond High Yield Index is down 0.9% year-to-date. The chart below shows how well corporate high-yield bonds have held up during the past six months, during which 10-year Treasury note yields have risen.
For now, the newsletter’s high yield bond fund timing model remains on a buy signal, while the more sensitive models we use for clients’ accounts are split: one on a sell, one on a buy. Recommended strategies for the 2022 climate include our taxable high yield and floating rate strategies. High-yield municipal bonds are off to a slow start this year, but there could be a tradable decline which would be a great opportunity. For the ultra-conservative, two-year Treasury notes are starting to pay 1% for the first time since the pandemic. We will have more to say about recommended bond strategies in the 2022 bond outlook in the next issue.
Figure: Total returns of high-yield corporate bond benchmark (BAML High Yield Master II, red) and investment grade bond benchmark (Vanguard Total Bond Market Index Fund, VBMFX, green) from 7/30/21-1/18/22, which was a period of rising 10-year Treasury note yields. Notice that high-yield bonds have held up much better (flat) than investment-grade bonds (down 3.6%), which is typical for rising rate climates.
To learn more about Marvin Appel, please visit Signalert Asset Management .


