

In our 2022 Volume Analysis Outlook, the S&P 500 (SPX) was fresh off new highs exceeding 4800, recalls Buff Dormeier of Kingsview Partners.
We suggested that while it is rarely a good idea to fight the trend, there were many signs of caution developing. As such, we discouraged the temptation of purchasing additional equities on potential forthcoming equity market pullbacks. We also identified two potentially key areas of market support to watch as key decision points. Now that the market has achieved the first of our two downside targets of 4410 (4315 being the second), in this issue of Volume Analysis we will once again review those criteria which earlier gave us pause. Further, we will update you on what those same leading indicators may be suggesting now.
Let’s begin with the chart below illustrating those breadth indicators that were strongly diverging from the broad market’s up trend.
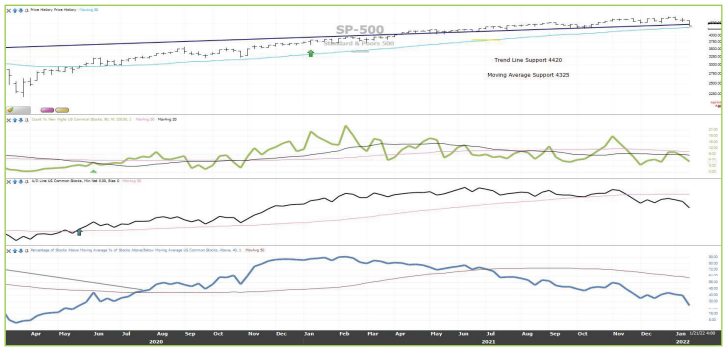
Source: StockFinder, Worden Brothers
Previously, we pointed out all three of these breadth indicators were bearish, diverging against the primary uptrend of the market raising the yellow precautionary flags. As of the date of this writing, all three indicators are still headed south. When new highs are falling, it may mean the market has stronger overhead resistance. When the advance decline is declining, this suggests liquidity is failing. And when percentage of stocks above trend is decreasing, it indicates many stocks are finding it more difficult to move up than down. A few weeks ago, all of these leading indicators were negative, and they remain so today.
Additionally, in our 2022 Volume Analysis Outlook we also discussed how daily capital weighted volume was also diverging from the broad market’s strong up trend. In the chart below, you can once again see this observation by reviewing the black trend lines. At the time, we viewed the price moving higher with less money participating as a warning sign.
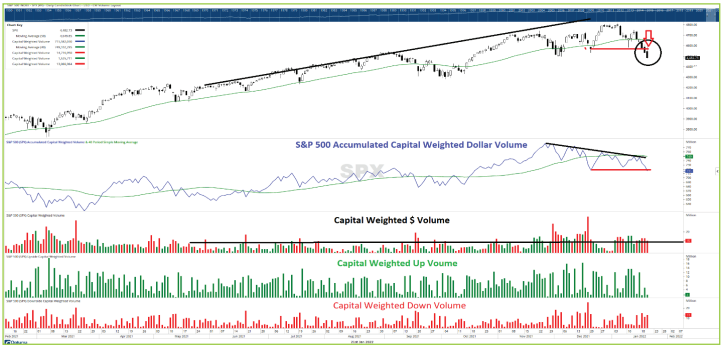
Source: OPTUMA (www.optuma.com/volumeanalysis)
Now, the S&P 500 is down about 8.5% from its former highs just a few weeks ago. When the S&P was making these new highs, we were pointing out that capital flows, measured by capital weighted volume and capital weighted dollar volume, were not making new highs. This was a secondary reason not to be fond of buying dips at the time. Now, let’s shift to today by examining the chart below. Now that the market is strongly moving downward, the capital outflows are not nearly as strong as the price direction. Thus, capital flows has now flipped to a positive sign for the bulls.
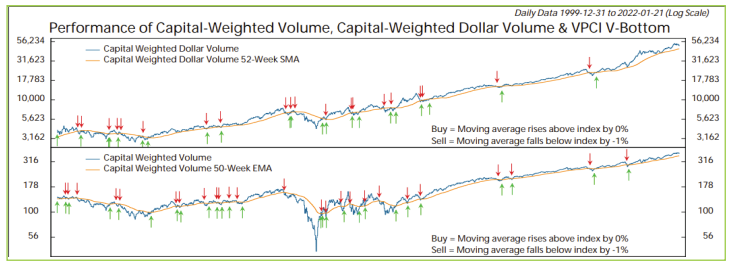
Source: OPTUMA (www.optuma.com/volumeanalysis)
The top panel in the chart above is capital weighted dollar volume. The blue line is how much money is flowing into or out of the S&P 500. The orange line is the trend of those capital flows (capital weighted dollar volume). Likewise, the middle panel shows capital weighted volume, which is how many shares are trading up or down within the S&P 500. Notice how both capital weighted volume and dollar volume still remain above their orange trend lines, despite the strong pullback in the price index. These two leading indicators confirm that we remain in a volume analysis bull market. In the aggregate, lack of strong capital flows out of the market suggests the “big money” apparently is not yet heavily participating in the market selloff.
Circling back to our opening comments, the S&P is at the critical support level identified a few weeks ago. Support levels represent decision points to either bail or recommit. The market internals we covered in this issue may be useful in forming market strategy. Correct interpretation of these leading indicators may allow us to distinguish between a correction and what may potentially become a bear market. While breadth remains bearish and the recent price action has been destructive, I am encouraged by the apparent lack of capital participating in the recent decline. Mirroring the tracks of institutional capital is what we strive to do. Presently, our indicators do not suggest institutions are caving during this decline. Thus, the return to support (4325) could potentially be an attractive entry point. That stated, risk management is always our number one priority, especially when market breadth appears to be so poor. Overall, despite the recent pullback, the intermediate broad market trend remains up. In the coming weeks, while the market weighs events and new data coming, we will continue to watch support at 4325 as the next critical decision point. Wishing you the very best my friends.
Learn more about Buff Dormeier here.


