

Holiday sessions like this week have a naturally bullish bias. That's because the joy of Thanksgiving typically leaks over to higher stock prices, states Steve Reitmeister of Reitmeister Total Return.
The risk is giving this upward movement any significance when the long-term trajectory is still decidedly bearish. Let's do a roll call of recent events that continues to point the compass to more downside action ahead along with our game plan to profit as stocks make new lows in the weeks ahead.
Market Commentary
So yes, stocks closed above notable resistance at 4,000 on Tuesday. But with more holiday sessions to go this week...then likely prices will continue to creep higher for a little while longer. The key at this stage, as it comes to price action, is whether stocks really have what it takes to clear the hurdle of the 200-day moving average (now at 4,062). Remember that this moving average (red on the S&P 500 (SPX) chart below) is considered the long-term trend line that really helps delineate bullish from bearish times.
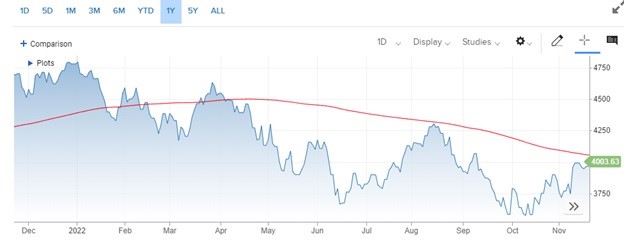
As you can see the market got bearish in a hurry this year with many failed attempts to break back above. This time will be no different. Why? The storm clouds are forming for a recession to start in the first half of 2023 as the after-effect of the Fed raising rates to tamp down the flames of inflation. Remember the Fed has already told investors that their long-term approach will come with a measure of economic pain. Whereas they “hope” to avoid a recession, they begrudgingly have to admit that it is not likely.
That message was served up loud and clear by Chairman Powell from his 11/2 press conference following the most recent 75 basis point hike. He was asked if the “window to create a soft landing for the economy had narrowed”. The look on his face was even more powerful than the words where he admitted that with inflation barely budging at this point, it would take a lot more Fed ammo to win the inflation battle. And thus, indeed very unlikely to create a soft landing. If no soft landing, then it means a hard landing (recession). Remember the famous words: Don’t fight the Fed!
So if they are telling you that they are far from done with their fight against inflation. And that the odds of a soft landing are closing in on zero. Then probably best to believe them and prepare for a recession which comes hand in hand with lower stock prices. Economists surveyed by the Wall Street Journal see the odds of a recession coming in the next year as up to 63% from the mid-October reading. This view falsely offers a bit of hope with a 37% chance of it not happening. And now I will pull the rug out by informing you that economists have a terrible track record. That’s because the average recession has come on the scene when the average probability was only 40%. In that light, you appreciate how daunting that 63% probability of recession is for our future outlook.
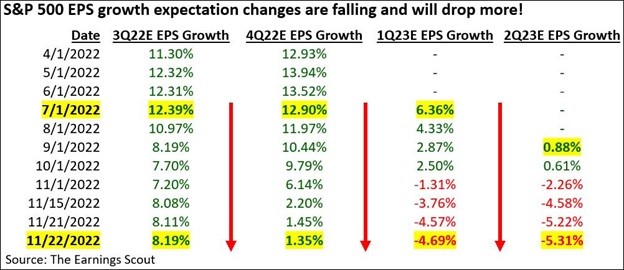
Wall Street analysts are also beating the recessionary drums as the most recent weak earnings season has led to a significant drop in estimates for the future. Q4 is nearing zero earnings growth. Whereas the first 2 quarters of 2023 are decidedly negative. What’s worse is that earnings experts, like Nick Raich of EarningsScout.com, expect there to be even steeper cuts in the earnings outlook ahead. That’s because Wall Street is always too optimistic at the start of a recession.
The roll call of foreboding indicators continues with the Chicago Fed National Activity Index this week falling into negative territory once again. This is a fairly broad reading of the economy which is at the lowest level in 4 months. The change in trend back to negative usually points to even lower readings ahead.
Next, we have the hit parade of three different regional Fed reports all pointing in the wrong direction. That starts with the Richmond Fed reading on Tuesday going from a positive of five for manufacturing down to -9. Services also tipped over to negative at -3. Thursday was no better with the Philly Fed Manufacturing index falling to -19.4. New Orders were also pointing south at -16.2 which points to more bad times ahead.
Lastly, as we scan across the country to the Kansas City Fed we see the composite index (manufacturing and services) at -10. All of this begs the question; Why have stock prices been going up for about six weeks in the face of such an obviously negative outlook?
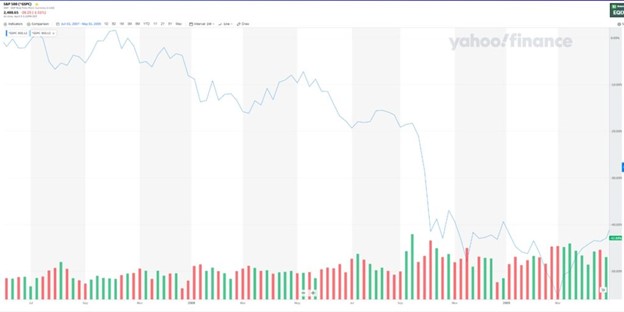
Because a bear market is a long-term process made with lower lows and lower highs on the bounces. Not just a smooth elevator ride to the bottom. That point comes through loud in clear with the S&P 500 price chart I shared above. And also comes through loud and clear for past bear markets like 2008-2009 below:
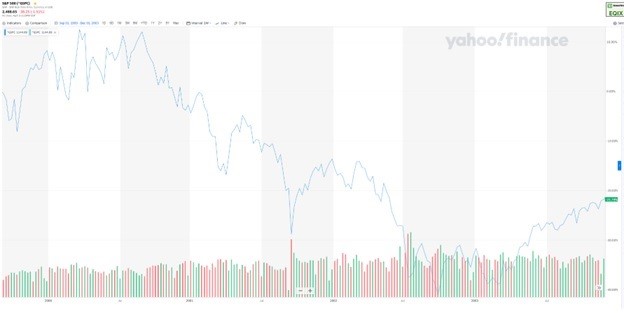
And for the previous 2000 to 2003 bear market:
This recent rally will probably top out soon as foolish bulls get thwarted at the 200-day moving average. Wise investors will appreciate the lessons from history and that you should not get bullish running into the recession. That is when it pays to bet on more market downside.
Once inside the recession, with stocks pressing lower, that is when it is wise to start betting on the bottom as the next bull market should be right around the corner. Not beforehand. So please enjoy the holiday season. Just don’t get fooled by the optical illusion of this holiday rally.


