

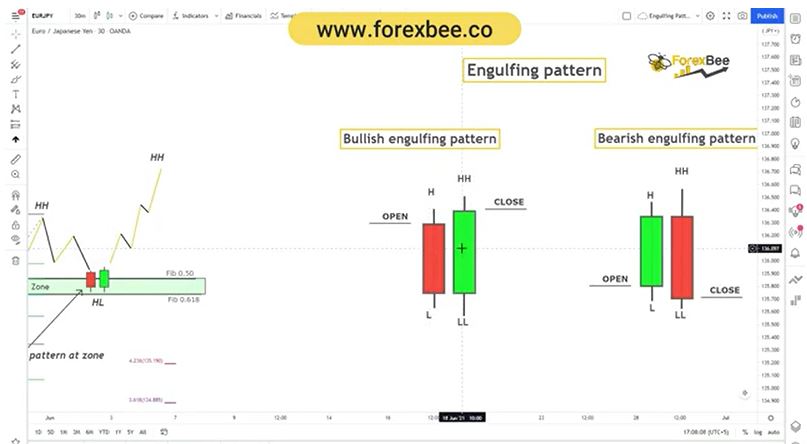
An engulfing pattern forms on a candlestick chart when a small candle is followed by a larger candle that reaches outside the previous candle’s trading range, says Steve Burns of New Trader U.
The new larger candle will make both a higher high and lower low than the previous smaller candlestick before it on the chart. Engulfing candlestick patterns can be bullish or bearish, but both can signal an overall increase in the size of the trading range and a rejection of a breakout in one direction.
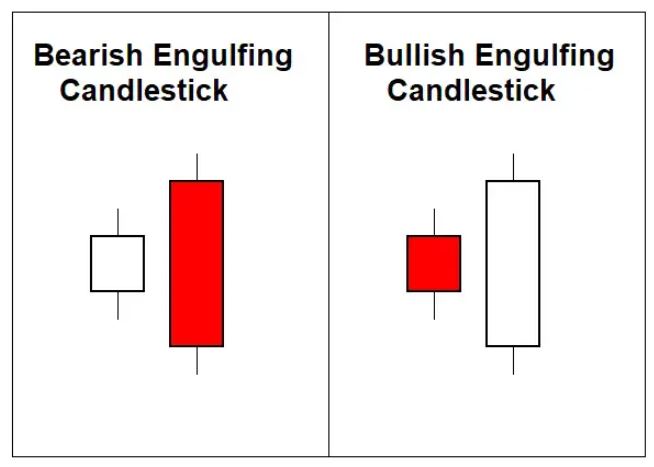
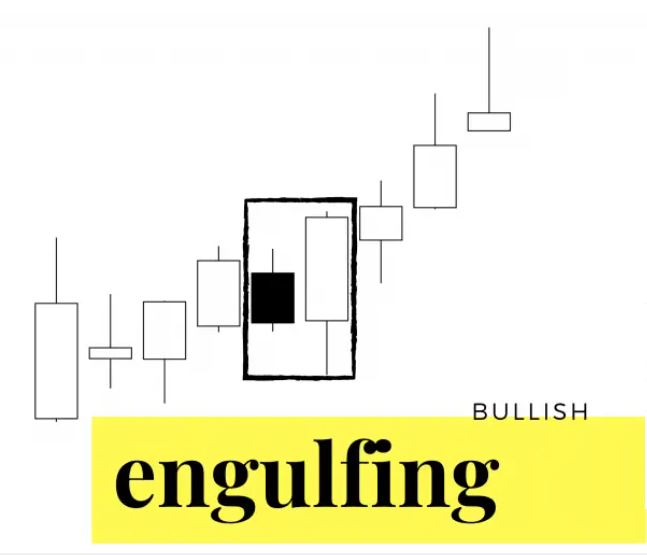
Bullish Engulfing Pattern
An engulfing bullish candlestick pattern is created when a small bearish black or red body candle happens on a chart, and then the next candle has a large bullish white or green candlestick body with both a higher high and a lower low.
This pattern shows that the previous day’s lows were lost but did not hold the breakout to the downside. The bullish candle shows both a rejection of lower lows and that there were buyers above the previous day’s high that were willing to bid the chart up and hold the price into the close on the daily chart.
When a two-candle bullish engulfing pattern happens near the bottom of a chart in a downtrend or when a chart has an oversold technical reading like a 30 RSI or third lower standard deviation from the mean price, it’s considered a significant bullish reversal signal.
The bullish engulfing pattern visually shows a change of sentiment from an initial bearish move down in the candle to strong bullish buying into that weakness that allows the price to reverse back higher and break above the previous day’s high. This candle can warn short sellers that they may need to reevaluate their position as buyers have taken control of the price action.
While this pattern can have meaning on multiple timeframes, it is most commonly used on the daily chart. This is a bullish reversal pattern during the end of a downtrend in price and can signal a new bullish swing or trend higher on the chart where it appears.
When the bullish engulfing candle happens near a short-term support price on a chart, it can signal a potential reversal and be a bullish buy signal.
Bearish Engulfing Patterns
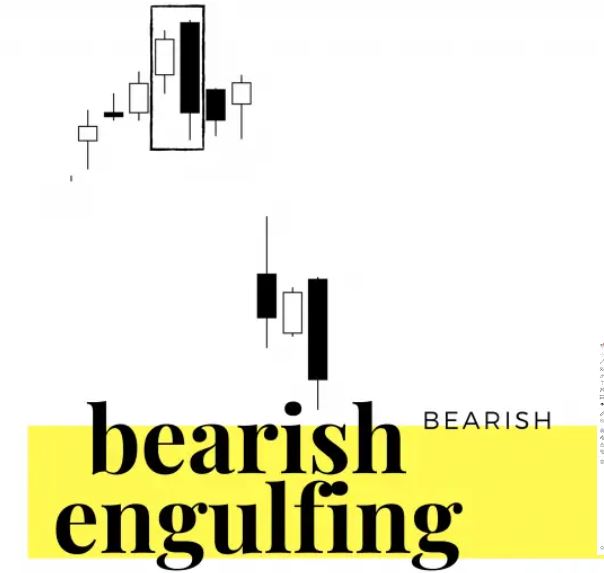
A bearish engulfing candle forms on a chart when a small body candle is inside the range of the next large down candle, which can be black or red, depending on chart settings. When a two-candle bearish engulfing pattern happens near the top of a chart in an uptrend or when a chart has an overbought technical reading like a 70 RSI or third lower standard deviation from the mean price, it’s considered a significant bearish reversal signal.
A bearish engulfing candle shows that buyers rejected higher prices from the previous day, and sellers stepped in to push prices all the way down under the previous day's support. This is a double bearish candle as buyers couldn’t hold the breakout to new highs over the previous candle’s range or hold the previous candle’s low price. This shows both the end of buying pressure and the beginning of selling pressure on the same candle.
The bigger the bearish candle is versus the previous candle, the more meaning it can have. The bearish engulfing candle has less meaning in volatile and choppy charts. There is a higher probability of a short selling position working with the bearish engulfing signal if the trader waits for the next candle to confirm the reversal with a follow-through bear candle.
The context of where the engulfing bearish candle appears is crucial as its meaning is more precise at the end of an uptrend than inside an existing trading range. The more confluences of other bearish technical signals that occur with the engulfing bearish candle, the greater the odds of it marking a top on a chart or a reversal lower out of a trading range.
Learn more about Steve Burns at NewTraderU.com.


