

As I outlined in the weekend analysis, the general expectation we maintain is that when the market finds a bottom in a wave one—assuming this is the bearish green count – then we oftentimes see a rally back to the .382 retracement for the [a] wave of wave two, states Avi Gilburt of ElliotWaveTrader.net.
While the exact path to that target is not easily knowable before we begin that rally, oftentimes the market can take a more direct path to that target due to how oversold we become on the downside move. And, that seems to have been the case this time as well. I also tried to explain this a bit more in detail in an alert to full-time members this morning:
“There are two ways to skin the cat here (sorry Merc), An (a) wave is most often a three-wave structure. That is why I expected the a-b-c structure for the (a) wave rally I expected to the 4300SPX region, as you can see on the chart. However, in a minority of occasions, the (a) wave will take shape as a five-wave structure. I have added that potential path here as well.
It seems that my initial assessment of an a-wave to the .236 retracement followed by a b-wave pullback is exactly what happened. But, the b-wave was so shallow, that it was nearly impossible to recognize it in real-time, as b-waves usually retrace towards the .618 retracement level of the a-wave. This is why I will not usually short the market during these types of [a] wave rallies off major bottoms, as they often carry higher and stronger due to the oversold nature of the market at the lows.
But, as it stands now, 4250SPX is our support for a potential wave 4 pullback. Below that, and I have to assume we are in the [b] wave. Also, keep in mind that a [b] wave pullback is likely going to be a much larger wave structure and likely take more time than a wave 4 of this degree.
I also want to re-post an alert I sent out this morning in our trading room:
“Bigger picture time. As they say, the easy part is now done. Off support, we expected a rally back to 4300+. And, it seems to have happened quite quickly. Now, this is going to get tougher.
Yes, I am expecting a pullback. I am still not sure if that pullback will begin from this general region, or if we pullback, hold over [4250]SPX, and then rally for a 5th wave higher. Either way, that will be an (a) wave, as shown.
The question will then begin with the type of pullback we see. The pullback MUST be a corrective one to expect another rally in the SPX. Should the next pullback be a CLEAR 5-wave decline, then I put on my bear suit, as it could begin that break down below 4000 sooner rather than later. For now, I am not expecting this.
Assuming that the next pullback below [4250]SPX is corrective, then I am looking for another rally—the (c) wave. Since (c) waves are five-wave structures, we will have to see how high it will project. A (c) wave that will likely complete into the wave 2 resistance box will keep us in the green count. A 5-wave decline after that (c) wave completes will tell us quite clearly to prepare for a very bearish next few months.
So, as I said, the easy part is now done. Now we have to stay on our toes. The next month or two is going to provide us with the distinction between green and yellow...finally.”
There is one more point I made in the trading room today that I also want to repeat in this update – which can be seen on the 60-minute SPX chart:
“There is one more point I want to make about the bigger picture, which should ease your minds if you should get FOMO on moves like this.
Assume the yellow count is going to play out. Again, we are FAR from making this assumption still. But, assuming that it is, it is still likely that the market will give us a b-wave pullback back to the region wherein we find ourselves right now...maybe a bit higher. So, is there a reason to be concerned about missing upside, rather than being a bit more cautious right now?
I don't think so. I think this 4300SPX region is going to be quite key in the coming months. Either it will be resistance for wave ii in green on a bounce after wave I down complete, or it will be supported on the b-wave pullback in yellow. We will likely be dealing with this region for a bit longer before the market makes a decision.”
So, let’s summarize where I think we are. First, as per the weekend update, we have now reached the 4300SPX region that we expected to see for the [a] wave rally of support. I think it is reasonable to now expect a pullback.
Should the pullback hold the 4250SPX region, and then begin another impulsive rally, then I will view that as completing waves four to five, as shown on the five-minute chart. That would be an extension to the [a] wave. Thereafter, we would expect a sizeable pullback.
However, should the market break down below 4250SPX, especially if it does so correctively, then I will assume that we are in the [b] wave pullback outlined on the chart. Once we have a top in place, I set the support box for the [b] wave pullback. But it will generally be the .382.-618 retracement of the [a] wave.
In the bigger picture, I am still unsure as to whether we have begun a rally in yellow, or if we are only going to get the [a][b][c] structure in green. It may still take us a few more weeks to make this determination. While a rally this large for the [a] wave is a good sign leaning towards the yellow wave count (in addition to other factors that I think support that wave count), I am not going to move into that as my primary count until I see more evidence. For now, I am maintaining the green count for risk management purposes.
And, again, as I noted above, there is no reason to get FOMO. Should the yellow count take shape, there will likely be a buying point during the larger degree b-wave pullback, which will likely take us back to the region wherein we now find ourselves. I see no reason to be getting aggressive to the long side just yet. This is why understanding the context of the market is so important. And, it is one of the benefits that only Elliott Wave analysis can provide to an investor.
Overall, please remember that we may be completing a second wave retracement, which will then lead to a third wave to the downside, which will first be pointing us down to the 3500SPX region for just that wave 3 as we look towards 2024. For this reason, I believe we must approach the market from a risk management perspective until we can begin to see the probabilities swing more toward the yellow count in the coming weeks.
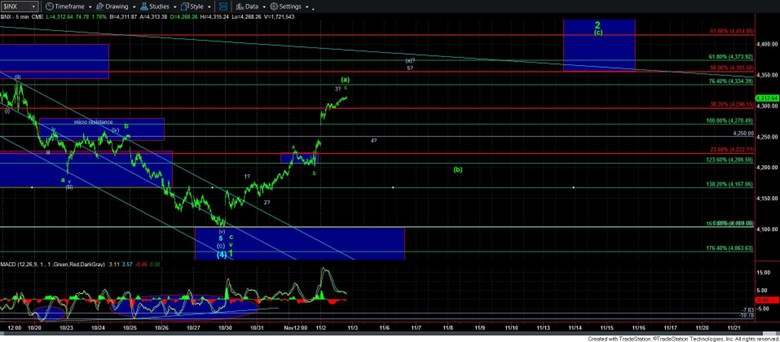
5minSPX
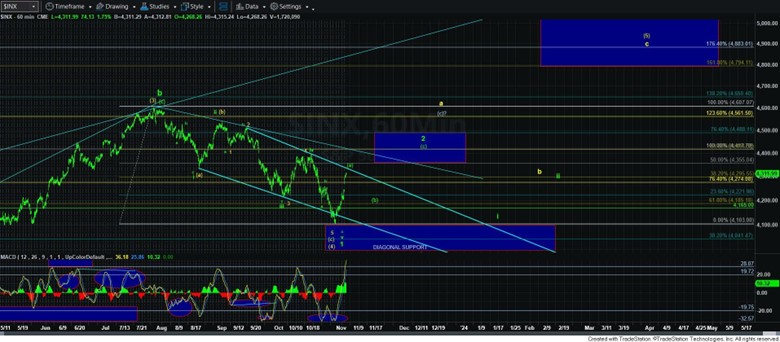
60minSPX


