

The stock market meets all definitions of a bull market including the recent breakout back above key trend lines; and 50 and 200-day moving averages, states Steve Reitmeister of Reitmeister Total Return.
The main reason for this recent rally is that long-term bond rates have finally ebbed lower after stampeding higher for the past few months. Unfortunately, this concept is a double-edged sword that needs to be discussed further. That will be the focus of today's edition of the Reitmeister Total Return.Market Commentary
The simple explanation for the correction that took place from August through October was raging bond rates. That’s because of this chain reaction: higher bond rates > higher corporate borrowing costs > lower investment in future growth > greater odds of recession > stock prices head lowerThus, not surprising that as bond rates headed lower after the 11/1 Fed meeting stocks got back on a bull run.
That reflexive action to unwind the rising rate bets is now over. As the joy subsides investors are left with the double-edged sword I noted in the intro. That being the potential negative side of lower rates may be happening because the economy is softening with increased odds of recession.
Note that coming down from +4.9% GDP sizzling growth in Q3 to say 1.5 to 2% growth is a good thing as it would most definitely put the final nails in the high inflation coffin. This would lead the Fed to become more dovish by lowering rates sometime in 2024 which would be of benefit to the economy > corporate earnings > stock prices.
But what if things are slowing even more? And what if it portends a possible recession ahead?
If true, then the cheers over lower rates will fizzle and stocks will have their natural reaction to recession...which is a bear market.
This tells us to be extra vigilant in reviewing the key economic data as it comes in. That starts with ISM Manufacturing from 11/1 which dropped from 49.0 to 46.7. Even worse was the forward-looking indicator of New Orders which was only 45.5. This was not a good start to November’s economic readings.
Next up was the Government Employment Situation report on 11/3 which was considered a “Goldilocks” announcement by investors leading to another rally to finish last week strong. The most beneficial part is the continued easing of Average Hourly Earnings which was only up +0.2% month over month which is getting ever closer to the Fed’s 2% annualized target.
What some investors did not appreciate in this is that 150,000 job ads are what economists believe to be the level that = neutral employment. This means that about 150K people are added to the employment market each month just by the nature of a growing population and more people getting to employment age. Thus, below that 150K mark is generally when you see an INCREASE in the unemployment rate.
A little increase is to be expected given the Fed’s hawkish policies to slow down the economy. But it could be indicative of a longer wave of unemployment. As some say, the weakening of employment is a bit of a Pandora's Box...once opened...then hard to stop all the monsters from getting out.
Next up was ISM Services later on Friday morning which did point to softening from the past given the decline from a solid 53.6 last month to a barely expansive 51.8 this time around. This too was under expectations. Yet there was a silver lining in a strong New Orders reading of 55.5 which points to healthier services growth ahead.
The total of the above details is by no means recessionary. But does show a softening of economic trends that could continue to erode and move towards recession in time.
Typically, the best way to sum up the economic picture is through by looking at GDP estimates for the coming quarter. And no one does that better than GDPNow from the Atlanta Fed that pretty well nailed the +4.9% reading for Q3.
Right now, that model points to only +1.2% GDP growth in Q4 while the Blue Chip economic panel consensus is even lower at +0.9%. The key is that right now most signs point to an economy GREATLY slowing down from the torrid pace of Q3.
As shared earlier, 1-2% GDP growth would be just fine because inflation would continue to moderate back to the 2% target and the Fed will start preparing to lower rates in early 2024.
Lower than that level of growth risks sparking a recession which begets lower corporate earnings...and yes...lower share prices.
This says we need to keep a vigilant watch on the economic data as it rolls in. The greater the odds of recession...the more defensive we need to get in our portfolios.
Now let’s turn to the...
Price Action & Trading Plan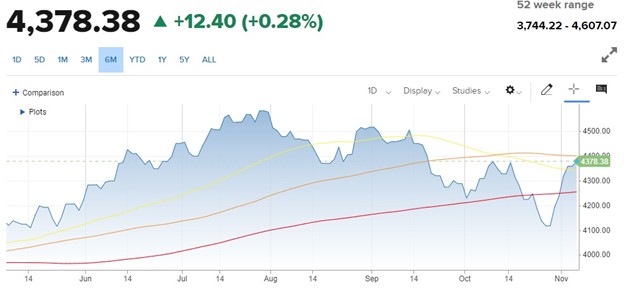
Moving Averages: 50 Day (yellow), 100 Day (orange), 200 Day (red)
The breakback above the 200-day moving average after the 11/1 Fed announcement is decisively bullish in the short run. Since then the 50-day has been toppled and likely will break above the 100-day (4,400) with any sort of Santa Claus rally unfolding.
I sense that the holiday spirits will have us somewhere between 4,500 and 4,600 to close out the year. So yes, a bullish bias is at play.
However, I would not call this a raging bull by any stretch of the imagination as that is only a 2-4% upside. And the past couple of days those index gains are only accumulating to the usual mega-cap suspects at the top of the S&P 500 food chain with losses found elsewhere.
Putting this together, I am leaning bullish in the Reitmeister Total Return portfolio...yet sleeping with one eye open for any whiffs of recession on the horizon. Note that I am by no means certain a recession is coming...just realized the ingredients are there for it to happen and don’t want the recent rise in stock prices to blind us from that economic possibility.
So yes, we could add another pick or two to the Reitmeister Total Return portfolio in the coming days to lean into the short-term bullishness. Especially companies that already won earnings season by flexing improved earnings prospects for the future. More on those best investment ideas in the next section.
Learn More About Reitmeister Total Return here…


