

The indexes have been just about straight up since October 27th, and were further fueled by the Fed, states Danielle Shay of Fivestartrader.com.
It’s natural to ask if the indexes can keep going higher at this juncture. While they are admittedly extended and could use a good pullback before the next leg is higher, I continue to believe the path of least resistance is higher, and the best path forward here is up. That means buying the dip, following the trend, and waiting for moments when you have an edge to buy.
Let’s talk about some of my top reasons to be bullish.
The NYSE Ticks
After Fed minutes, we saw some of the strongest and most consistent buying I have seen all year. The NYSE ticks (a measure of buying versus selling pressure–$TICK) were hovering in the +800-1000 range for over an hour, reaching highs of +1575. This is STRONG buying!
Check out this screenshot of the $TICKs. Do you see how the tick action was between -600 and +600 (i.e. the neutral zone) until the Fed minutes were published? After that, they jumped up into buying territory.
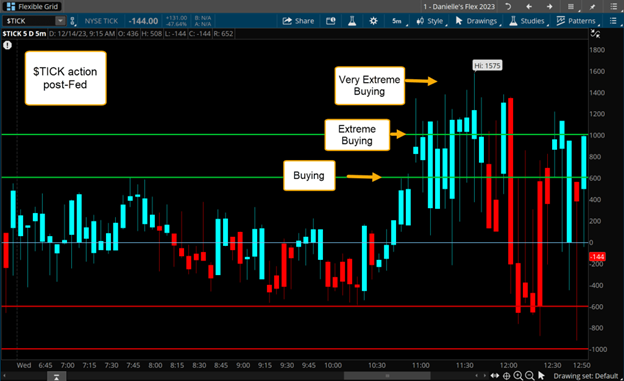
It’s normal to see $TICK spikes in either direction, post-Fed. But to see this spike up into +1000 and then have it continue at that zone for over an hour and go higher instead of lower was indicative of solid and consistent buy programs. That is big money moving! When you have a big money flow like that to the upside, that is a great reason to be bullish.
Generally, a move like that is so strong that there is absolutely zero reason to stand in the way and a great reason to go with the flow.
The Ten-Year Treasury Index
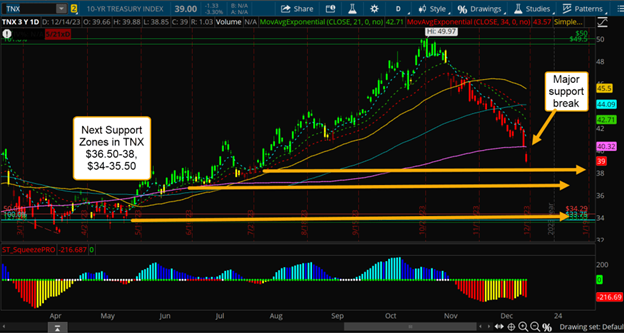
Arguably, the heaviest weight on the Nasdaq, the housing market, and the economy have been the Fed and high rates. Those rates move somewhat based on the Ten-Year Treasury Index (TNX), which has fallen off a cliff (10-year down = rates down). Yesterday, it was sitting directly on a support zone (at the 200 SMA) where it could have bounced, but guess what? Today, TNX fell off this ledge and is down another -3.25%! A break through the 200 SMA is pivotal here, and this break means mortgage rates will go even lower tomorrow. It also lifts a weight off tech and allows it to continue higher.
So, where could TNX go next? Now that it’s broken down below $40, my next target zones are listed below:
The VIX
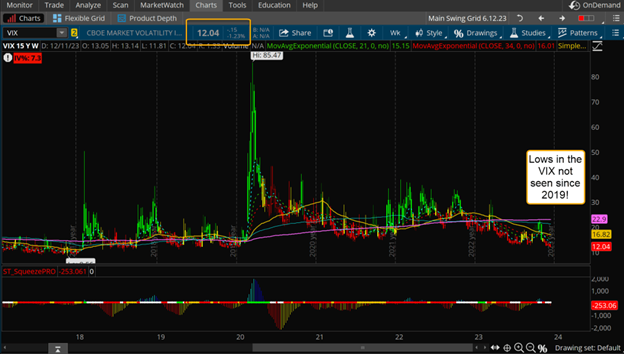
The Cboe SPX Volatility Index (VIX) is a great indication of what kind of market we have and what type of trading we can do. Generally, if the VIX is above 17, the market is somewhat volatile, and above 23, it’s incredibly volatile. That means we must adjust our trading strategies, time frames, and risk parameters to be more cautious due to the volatility. However, at this point, not only has the VIX fallen below 17, it’s at a low not seen since 2019! Today, the VIX is sitting at 12. This makes for a nice and easy trending market with little volatility or worry. Yet, another reason to be bullish.
Conclusion
So, there you have it. Three reasons to be bullish! The NYSE Ticks, the ten-year treasury index, and the VIX.
Learn more about Danielle Shay at Fivestartrader.com.


