
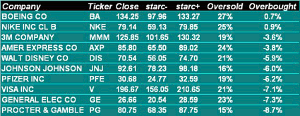
A monthly look at the 30 stocks in the Dow Industrials reveals the ten that are the most overbought based on starc+ band analysis, and MoneyShow’s Tom Aspray likes three of these stocks on a meaningful correction.
It was another great month for the stock market particularly after October’s stellar performance. The iShares Russell 2000 (IYM) and iShares Dow Transportation (IYT) led the way, gaining 3.9%.
Tech was not far behind as the PowerShares QQQ Trust (QQQ) was up 3.5% but with the bullish yearly charts for the largest tech stocks, this is was not surprising. For a change, the SPDR Dow Jones Industrials (DIA) outpaced the Spyder Trust (SPY).
There is a full week of economic data with the ISM Manufacturing and Non-Manufacturing, as well as the GDP and the monthly unemployment report on Friday. Some of the lagging technical indicators, like the NYSE Advance/Decline did improve last week, as it broke through short-term resistance. Others, like S&P A/D line, formed a short-term negative divergence.
One strong down day could signal a pullback or a more serious correction as some stocks are quite overextended. Of course, it is also possible that we will see rotation into lagging sectors, like the homebuilders, that would fuel further gains.
Click to Enlarge
This month’s starc band scan shows that only two Dow stocks are trading above their starc+ bands while a higher percentage of the S&P stocks are giving overbought readings. As part of this analysis, one also needs to look at the monthly readings of the technical studies like the relative performance and on balance volume.
From the multiple time frame analysis of these indicators, one can get a better idea of the long-term potential for these stocks, as well as a better idea of which are most vulnerable. Leading the list this month is Boeing Company (BA), which closed the month 0.7% above its monthly starc+ band. It is already well below the mid-month high of $142.
Here are four of the ten most overbought Dow stocks that I found the most interesting.
Click to Enlarge
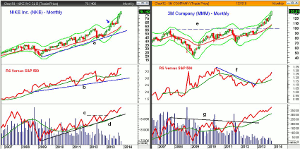
Chart Analysis: NIKE, Inc. (NKE) is a recent addition to the Dow that has been testing its monthly starc+ band for the past three months as it is up 26% from the August close.
- During March-May of 2013 (see arrow), NKE also tested the starc+ band before consolidating for three months.
- NKE has exceeded its quarterly R1 resistance with the R2 at $83.21.
- The relative performance made new highs last month and is well above its rising WMA.
- The monthly OBV broke through resistance, line c, at the end of February and also made new highs in November.
- There is long-term OBV support at the uptrend, line d, and the rising WMA.
- The weekly and daily RS and OBV analysis are also confirming the price action.
- There is first good support now in the $76.50 to $78.20 area.
- The monthly support is now in the $68-$70 area.
3M Company (MMM) has made higher highs for the past five months and was a recommendation from the September scan of Dow stocks.
- The long-term chart shows that resistance going back to 2007, line e, was overcome at the end of last January.
- MMM has exceeded both the quarterly R1 and R2 resistance with the R3 at $136.33.
- This is not far above last Friday’s high at $134.16.
- The relative performance broke its downtrend, line f, at the end of November 2012.
- The following month, it moved above its WMA and is still rising sharply.
- The RS line is still below the highs from 2010.
- The OBV overcame its resistance, line g, at the end of February 2012.
- It has made new highs in November with the weekly/daily also looking strong.
- The monthly pivot at $130.84 represents first good support.
- The first real monthly support is in the $126-$126.60 area, which is 5.6% below current levels.
NEXT PAGE: 2 More Stocks to Watch
|pagebreak|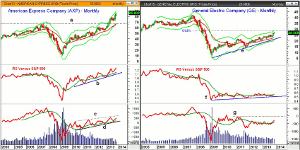
Click to Enlarge
American Express Company (AXP) has had a good year as it is up over 50% YTD versus a 39% gain in credit services, which is its industry group.
- AXP closed above its monthly starc+ band in May, then moved sideways for four months before surging to the upside.
- The quarterly R3 resistance at $85.80 was exceeded last Friday.
- The monthly relative performance did make a new high in November and is well above the 2007 highs.
- The RS line has good support at its uptrend, line b, and its rising WMA.
- The OBV dropped back to test its rising WMA in August but is still below the May highs.
- The upward trading channel, lines c and d, is positive but the OBV is well below the 2007 highs.
- The weekly and daily OBV are still confirming prices with the weekly now well above the 2007 highs.
- The monthly pivot for December is at $84.07 with the projected monthly pivot support at $81.85. Stronger monthly chart support is in the $78.60 area.
General Electric (GE) has done just slightly better than the SPY this year as it is up 29.7% YTD. The mid-November high of $27.50 exceeded the quarterly R3 resistance at $27.14.
- It is still below the 61.8% Fibonacci retracement resistance of $28.18 at $28.24, which is calculated from the 2007 high at $42.16.
- GE has not closed below its 20-month EMA since November of 2011.
- The relative performance has not confirmed the price action as it has been basically flat since the start of the bull market, line f.
- The weekly RS line has turned down after failing to move above the October 2012 highs.
- The OBV has reached its highest level since early 2012 but is still below the resistance from 2011,
line g. - The weekly OBV did confirm the recent highs but has turned lower as has the daily OBV.
- There is next support in the $26 area with the 50% Fibonacci retracement support from the September lows at $25.20.
- There is monthly support in the $23.80 to $24.40 area.
What It Means: Those stocks that have been trading at or above their monthly starc+ bands are especially vulnerable to profit-taking when the market corrects. The fact that several of these stocks have also reached or exceeded their quarterly R2 or R3 resistance supports this analysis.
All four of the stocks, except General Electric (GE), will look attractive on a meaningful correction.
How to Profit: No new recommendation
Portfolio Update: For 3M Company (MMM), should be 50% long at $117.74. Sell ½ at $132.40 or better for over a 12% profit. Use a stop now at $124.28.


