Most of the airline stocks came under selling pressure after beating their earning’s estimates last month, so MoneyShow’s Tom Aspray investigates the charts to see if further weakness this month could take them to stronger support and create a lower risk buying opportunity.
Stocks stabilized on Monday with the oversold small-cap and oil service stocks leading the way. This was enough to turn the technical studies higher as the McClellan oscillator rose to -144 from last Friday’s low of -278. The A/D lines have also turned up but are still well below stronger resistance and their bearish formations favor a failing rally.
For the near term outlook, the main question is whether the oversold rally will last just another day or two, or whether it will last three-to-five more days before the selling resumes. The futures are lower in early trading and a drop below Monday’s low would be a sign of weakness. On the upside, the key levels for the Spyder Trust (SPY) are in the $194.60-$195.20 area with a chance that the 20-day EMA at $196.35 could be challenged before the decline resumes.
Though the crude oil futures have bounced from last week’s lows, the October crude oil contract is still $8 per barrel below the late June highs. The Dow Jones Airlines Index (DJUSAR) is one of the best performing industry groups this year as it is up just over 32%. This is despite the recent decline of over 9% in DJUSAR from the early June highs as most of the airline stocks came under selling pressure after beating their earning’s estimates last month.
Will lower crude create a new buying opportunity in the airlines and basis the seasonal analysis when is the time to buy?
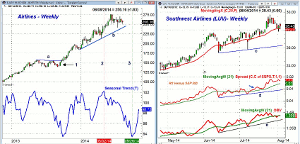
Chart Analysis: The chart of the Airlines index shows that it formed a high close doji buy signal last September (point 1).
- This was followed by a move through resistance, at line a, two weeks later, which was the start of a nine month rally of 66%.
- The seasonal analysis, using fifteen years of data, shows that the airlines typically peak on May 2 (line 2).
- This is followed by a period of weakness with a typical bottom forming on September 26.
- So far, the correction is holding well above the quarterly pivot at $249.74 and the weekly uptrend, line a.
- The monthly projected pivot resistance is at 227, which is 11% below current levels.
- A move above the July highs would be the first sign that the correction was over.
The daily chart of Southwest Airlines (LUV) shows the sharp drop in both June and July as the $25.50-$26 area (line c) was tested.
- This was followed by a push to new highs at $29.70 which was above the monthly projected pivot resistance.
- LUV is up 51.4% YTD even though it dropped back to the monthly pivot at $27.90 last week.
- For August, the projected pivot support is at $26.19 which is 7.8% below Monday’s close.
- The quarterly pivot is a bit lower at $25.62.
- The daily relative performance broke out of its trading range ahead of prices (see arrow).
- The RS line made new highs with prices and is holding well above its rising WMA.
- The OBV shows a pattern of higher highs, line e, but dropped below its WMA last week.
- A decline below Friday’s low at $27.84 should signal a further decline.
NEXT PAGE: Two More Airlines to Watch
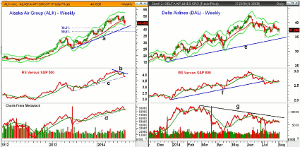
|pagebreak|Alaska Air Group (ALK) peaked at $50.47 in early June and has been lagging LUV as it is only up 19.7% YTD. It is down 13.84% from its 52-week high.
- ALK formed a secondary peak two weeks ago at $50.10 before it dropped 9% on July 24, despite beating earning’s estimates.
- The weekly starc+ band is at $42.37 with the 38.2% Fibonacci retracement support at $40.75.
- The weekly uptrend, line a, is a bit higher with the 50% support at $37.69.
- The relative performance has formed lower highs, line b.
- The RS line is now testing the uptrend from the 2013 lows.
- The weekly OBV closed last week just below its WMA and the uptrend, line d.
- The daily OBV (not shown) peaked in early April and has since formed lower highs.
- There is initial resistance at $44.60 with the monthly pivot at $46.
Delta Airlines (DAL) has also done very well in 2014, as it is up 36.15% YTD.
- From the June high at $42.66, DAL has declined 12.6% as it is testing the quarterly pivot at $37.29.
- In early July, the low was $34.77 with the uptrend, line e, at $34.21.
- The weekly starc- band is at $32.97 with the monthly projected pivot support at $31.91.
- The relative performance did confirm the June highs but then violated its support (line f) in early July.
- The weekly RS line (not shown) has turned down after testing its WMA.
- The daily on-balance volume (OBV) shows a pattern of lower highs, line g, as it peaked in late February.
- The OBV has stayed in a tight range over the past few weeks but shows no heavy selling pressure yet.
- There is first resistance in the $38.80 area with the projected pivot resistance at $40.32.
What it Means: Even though Alaska Air Group (ALK) and Delta Airlines (DAL) are both well below the year’s highs, there are no clear signs yet that they have completed their corrections.
They may be getting close and further weakness this month could take them to stronger support and create a lower risk buying opportunity.
How to Profit: No new recommendation.


