
By Jamie Saettele, currency analyst, DailyFx.com
I find that the best trading ideas are the ones that aren’t yet attached to a big story. For example, not many wanted to sell the EUR/USD at 16000. The same might be said in 2011 for selling the yen, and the Australian and New Zealand dollars (especially AUD/USD and NZD/USD). It is fun to speculate on what the story could be though. Perhaps China’s authoritative ways will lead to increased uncertainty on the Pacific rim; or maybe Australia’s housing market will collapse; or maybe all of the above. Let’s see what the charts say.
Yen Futures and TLT (iShares 20+ Yr Treas. Bond) ETF Daily Bars:

Click
to Enlarge
It’s no secret that the yen and US debt have traded in tandem, especially over the last several years. The yen led debt at bottoms in April 2009 and April 2010 and debt led the yen at tops in October 2009 and August 2010. The decline in debt from the August top is impulsive (five waves), which indicates a significant change in trend. Allowing for a corrective setback, the TLT (and long-term US debt) is in a bearish situation. Assuming that the current relationship holds (and relationships can certainly change), the bulk of yen weakness has yet to occur (USD/JPY bullish).
US Dollar/Japanese Yen—Monthly Bars
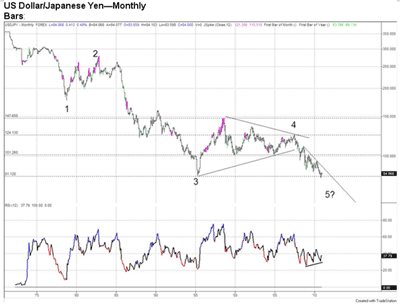
Click
to Enlarge
I think I’ve shown this chart several times each year since 2007 (when wave four triangle ended). The implications had always been for the USD/JPY to register a new all-time low before reversing. Now, it seems unlikely that the large fifth wave is complete after just three years, but RSI divergence and the recent bullish engulfing pattern (October and November candles) suggest a relief bounce at minimum. 8800 is the next level of chart resistance (meets the trend line in March/April 2011). Given the potential for a short-term rally in debt (corrective rally after the five-wave decline), the yen could see one more surge (USD/JPY decline). As such, I favor buying a USD/JPY decline. Keep in mind that the decline might test or result in a drop below the previous low of 8024.
NEXT: Key Trends Affecting the Australian Dollar
|pagebreak|Australian Dollar/US Dollar—Monthly Bars
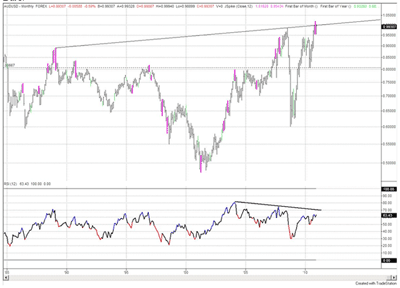
Click
to Enlarge
The 22-year upward-sloping inverse head-and-shoulders pattern (22 years from shoulder to shoulder) is ultimately bullish for the AUD/USD, but several tests of the breakout level are probably in order before the “real” break occurs. RSI divergence on the monthly chart and the key reversal month in November (magenta bar) favor a contrarian stance as opposed to a breakout strategy.
Australian Dollar Futures - Weekly Bars

Click
to Enlarge
A five-wave rally is visible on the weekly from the October 2008 low, therefore, a correction of the rally is expected. Again, divergence with RSI warns of a turn, but so does COT positioning. Speculative longs (in dark blue) were recently greater than at the last important top (2008), and markets usually don’t take kindly to an inordinate amount of speculative long positions. It is unclear if the final AUD/USD top is in place—major tops are often elusive. Even a new high should prove terminal, however. As always, I’ll look to identify and publish low-risk entries through the DailyFX Forex Stream. An objective is the former fourth wave extreme, near 8000.
AUD/USD and NZD/USD—Monthly Closes
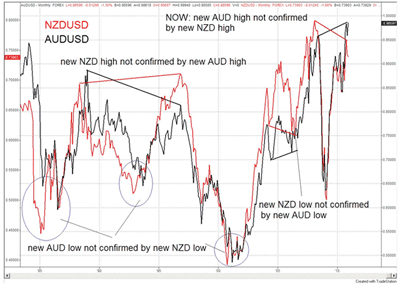
Click
to Enlarge
Divergence between related assets is often overlooked. That may be why it works so well. Clearly, the AUD/USD (in black) and NZD/USD (in red) are highly correlated. But at major turns, there has been a tendency for one currency to make a new high or low as the other currency lags behind. In other words, there is a lack of confirmation (divergence). Currently, the AUD/USD has exceeded its 2008 high without the NZD/USD exceeding its 2008 high. This is bearish for both the AUD/USD and NZD/USD. A NZD/USD objective is below 6560.
By Jamie Saettele, currency analyst, DailyFx.com


