
Alan Ellman, of TheBlueCollarInvestor.com, focuses on one of the three factors for option traders to consider—overall market assessment—and outlines the roles that economic indicators play in relation to covered call writing and put-selling results.
Covered call writing and put-selling results are enhanced by selecting the best underlying securities and most appropriate options. Stock selection involves screening via fundamental and technical analysis as well as common sense screens (like avoiding earnings reports). Option selection is based on several factors including chart analysis, overall market assessment, and personal risk tolerance. In this article, we will focus in on overall market assessment using the myriad of weekly economic reports available to us.
These reports can be categorized into four major groups:
- Labor market conditions
- Consumer health
- Business health
- General economic indicators
Here is a summary of several of the most critical reports:
Labor Market Conditions
Employment Situation
A monthly report of the number of persons on nonfarm payrolls, the rate of unemployment, and workers’ average hourly earnings. It is considered a very timely and accurate reflection of labor market conditions. The unemployment rate is a key business cycle indicator.
Initial Jobless Claims
A weekly report of the number of individuals who filed for unemployment insurance for the first time the prior week.
Consumer Health
Consumer Confidence
A monthly gauge of consumers’ attitudes about the present economic situation as well as their expectations regarding future conditions. Consumer confidence tends to have a strong correlation with consumer spending patterns.
Personal Income; Personal Spending
A monthly report of the income that households receive from all sources. Since income is the major determinant of spending, the report is an indicator of future consumer spending patterns.
Retail Sales
A monthly report of the dollar value of sales of a broad range of goods. Retail sales are a major indicator of consumer spending trends.
Durable Goods Orders
A monthly measure of the number of orders for a broad range of products with an expected life of at least three years. Durable goods orders are a leading indicator of industrial production and capital spending.
New Residential Construction
A monthly report on the construction of single-family homes and apartment buildings. When new residential construction is robust, purchases of household furnishings and appliances tend to quickly follow.
Existing Home Sales
A monthly report of the number of previously constructed homes with a closed sale during the month. Existing home sales make up a larger share of the market than new home sales and indicate housing market trends.
New Home Sales
A monthly report of the number of newly constructed homes with a committed sale during the month. The level of new home sales is an indicator of housing market trends.
Construction Spending
A monthly measure of the dollar value of new construction activity. Construction projects contribute significantly to gross domestic product.
Business Health
Business Inventories
A monthly report of the dollar value of product inventories held by manufacturers, wholesalers, and retailers. Included in the report is the number of months it would take to deplete existing inventories at the current rate of sales, which is an important indicator of the near-term direction of production activity.
Industrial Production
A monthly measure of the changes in quantity of physical materials and items produced in the manufacturing, mining, and utilities industries. Industrial production is a significant indicator of trends in the industrial sector.
ISM Manufacturing Index
A monthly indicator of overall factory-sector trends, based on a survey of purchasing managers at several hundred manufacturing firms in a variety of industries. An index reading above 50 indicates that the manufacturing economy is generally expanding; below 50, that it is generally declining.
ISM Non-Manufacturing Index
A monthly indicator of overall service-sector trends, based on a survey of several hundred purchasing and supply executives in a variety of nonmanufacturing industries. A reading above 50 indicates that the nonmanufacturing economy is generally expanding; below 50, that it is generally declining.
NEXT PAGE: General Economic Indicators and the Roles They Play
|pagebreak|General Economic Indicators
Leading Economic Indicators
A monthly composite index of ten economic indicators that typically lead overall economic activity. The index includes indicators such as housing permits, new orders for consumer goods, consumer expectations, and performance of the S&P 500 Index.
Consumer Price Index (CPI)
A widely followed indicator of inflation. The CPI is a monthly measure of the average change over time in the prices paid by urban consumers for a fixed market basket of consumer goods and services. The core CPI excludes food and energy prices, which account for roughly one-quarter of the broad CPI and tend to fluctuate widely, providing a truer reflection of inflationary trends.
Producer Price Index (PPI)
A monthly measure of the average change over time in the selling prices of a fixed basket of goods by stage of production, industry, and commodity. It is considered a leading indicator for consumer inflation. The core PPI excludes food and energy prices—which account for roughly one-quarter of the broad PPI and tend to fluctuate widely—providing a truer reflection of inflationary trends.
Gross Domestic Product (GDP)
A quarterly record of the country’s economic health. GDP represents the total value of the country’s production and consists of purchases of domestically produced goods and services by individuals, businesses, foreigners, and the government.
The Role of These Reports
A generalization can be gleaned from these reports evaluating them as favorable, mixed, or unfavorable. Assuming favorable chart technicals and an average risk-tolerance, a favorable overall market assessment would lead us to select out-of-the money call options or put options that are closer to at-the-money than out-of-the money strikes. Both represent more aggressive option-selling positions. If our overall market evaluation was less favorable, we may opt for in-the-money call options and deeper out-of-the-money put options, both more conservative approaches to option selling.
Accessing the Information
Each week I summarize the weekly economic reports at the end of my blog articles and page 1 of our Premium Stock Reports. We also publish the overall market assessment of Investor’s Business Daily and that of Dr. Eric Wish, a Professor at The University of Maryland who teaches an honors finance course. His GMI indicator is a fabulous resource for overall market evaluation. This, of course, is in addition to the market appraisal of BCI as shown in the screenshot below and at the end of this article:
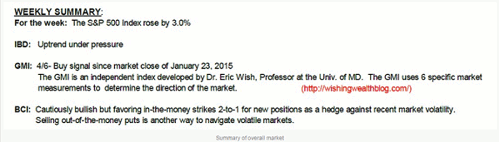
Click to Enlarge
Market Tone
This was an extremely light week for economic reports with most of the market’s focus on Greece’s economic hardships. Meetings of EuroZone finance ministers, the International Monetary Fund, and the European Central Bank were closely monitored:
- Retail sales (a report of the dollar value of sales of a broad range of goods, from cars and gasoline to furniture, food services, and clothing. Retail sales are a major indicator of consumer spending trends, accounting for a substantial portion of total consumer spending and aggregate economic activity) dropped by 0.8% in January the second consecutive monthly decline according to the Department of Commerce. A dip of 0.5% was anticipated. A major factor in this slump is lower gas prices. Sales, however, did increase for food and beverage-related businesses as well as for auto dealers
- Year-over-year, retail sales increased by 3.3%
- According to the Commerce Department, business inventories (a report of the dollar value of product inventories held by manufacturers, wholesalers, and retailers. Included in the report is the inventories/sales ratio, a gauge of the number of months it would take to deplete existing inventories at the current rate of sales, which is an important indicator of the near-term direction of production activity) rose by 0.1% in December, slightly below the 0.2% expected
For the week, the S&P 500 rose by 2.0%.
Summary
IBD: Confirmed uptrend
GMI: 5/6—Buy signal since market close of January 23, 2015
BCI: Cautiously bullish using an equal number of in-the-money and out-of-the-money strikes.
This was a positive earnings season overall.
By Alan Ellman of TheBlueCollarInvestor.com


