
Implied volatility changes are one of the critical risk factors for many options trades. We may also use our predictions of implied volatility changes as the basis of our trade, explains Kerry Given, PhD, founder of Parkwood Capital.
Get Trading Insights, MoneyShow’s free trading newsletter »
Implied volatility often surprises novice options traders. The trader who is bullish on Apple buys a call option; Apple stock trades higher and yet the price of the call option is either unchanged or perhaps even lower. Often a change in implied volatility is the culprit.
Option traders are always aware of the current value of implied volatility for the option(s) being traded, and even more importantly, the historical range of implied volatility levels for that stock or index.
The possibility of the level of implied volatility changing during the course of a trade must always be considered as one of the risk factors for the position.
The trader may take the offensive by predicting changes in implied volatility and trading that prediction. There are several ways of playing changes in implied volatility:
- Buying and selling volatility options and option spreads on broad market indices, e.g., the VIX options for the S&P 500 Index.
- Buying one of the volatility exchange traded funds (ETFs): ProShares Short-Term Futures (SVXY), VelocityShares Daily Inverse VIX Short-Term ETN (XIV), etc.
- Selling stock and index option straddles and strangles in high volatility environments.
And this is far from an exhaustive list.
Imagine a common situation we all face with our stock holdings: the quarterly earnings announcement. Typically, the implied volatility of the stock’s options rises in advance of the announcement and then collapses immediately after the announcement.
We could sell an out of the money (OTM) call option above the current stock price and sell an OTM put option below the current stock price. This is known as a short strangle. As long as the stock price remains between the two strike prices we sold, we will have a profitable trade. The declining volatility after the event accelerates that move to profitability.
Consider a recent example. Apple (AAPL) was scheduled to announce earnings after the market closed on August 1, 2017. AAPL was trading at $150. We could have sold the AAPL Aug(8/4) 160 call option and sold the AAPL Aug(8/4) 140 put option. If we sold one contract of each option, our maximum gain would be $40 if both options expired worthless. The risk/reward diagram is plotted in Figure 1. The black line represents the profit or loss at expiration. We have a relatively small gain, but we have a wide range of profitability.
This is a classic high profitability trade with a relatively small potential gain but the potential losses are unlimited if Apple trades much higher or much lower than expected. There is a small probability of that happening, but we may not be comfortable taking that risk. We can easily limit those potential losses by buying a call option above the strike price we sold and buying a put option below the strike price we sold. This transforms our short strangle into an iron condor spread. The new risk/reward diagram is plotted in Figure 2. We have transformed a trade with unlimited potential losses into a position with limited potential losses.
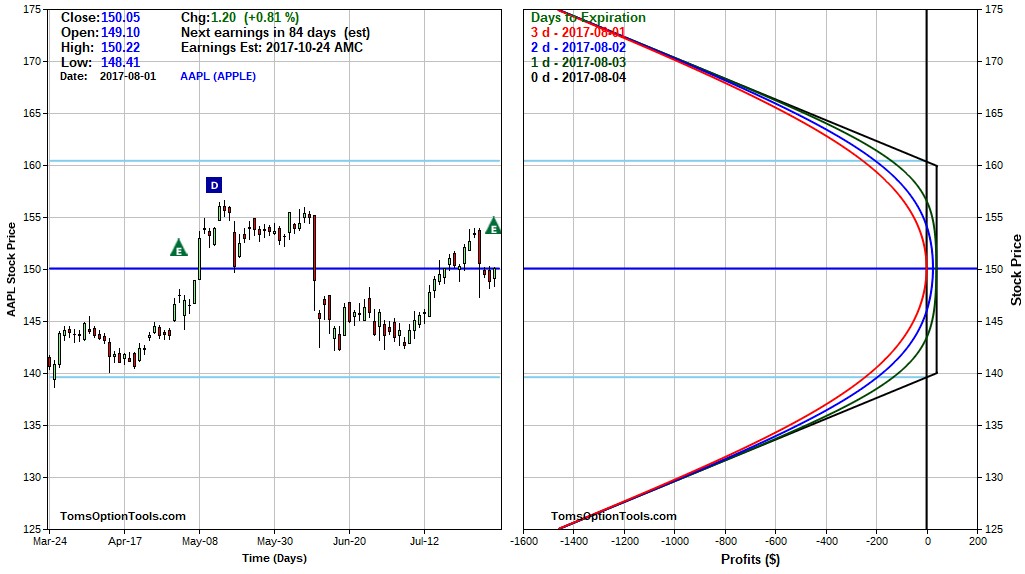
Figure 1: AAPL Aug(8/4) 140/160 Strangle
Chart courtesy of TomsOptionTools.com
If Apple plunged to $125 after the announcement, the strangle would incur a loss of approximately $1,500 per contract but the iron condor’s loss would be limited to less than $500. That illustrates the risk limiting power of the long options.
Apple’s earnings announcement was well received and the stock opened at $157 the next day and settled a bit by expiration Friday, closing at $156. All of the options in the iron condor would have expired worthless and the trader would have gained a little over 6% in three days.
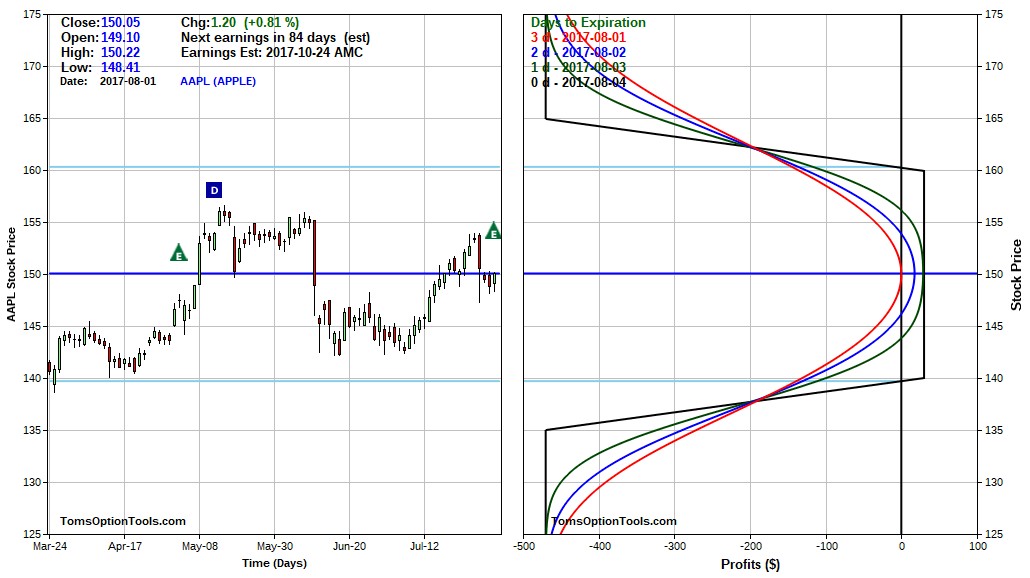
Chart courtesy of TomsOptionTools.com
That is the high-level view of this trade. But we have ignored several important questions about establishing this position:
- What is the role of volatility in this trade?
- Why did we choose the August 4 expiration for the options?
- How did we choose the strike prices we bought and sold?
The role of volatility
Implied volatility of a stock’s options is normally bid up as the speculation before the earnings announcement builds up. This is especially true for the options with the shortest expiration that includes the date of the announcement. This increase in volatility varies from stock to stock, and may also spike higher for stocks in special circumstances that may affect the stock price, such as patent disputes, management changes, etc.
If we were to sell a strangle, we would benefit from the heightened volatility because we are selling expensive options. The levels of implied volatility will decrease markedly after the announcement, causing the prices of the options we sold to decrease. Of course, this assumes that the stock price does not approach either strike price that we sold after the announcement. If we position the options safely OTM, as we discuss below, this trade will have a probabilistic edge that is generated by the excessive volatility generated in the speculation preceding the announcement.
If we hedge each side of the trade and create the iron condor, we will observe another characteristic of implied volatility changes in option spreads. When we buy or sell an option spread, the maximum profitability is fixed at expiration and cannot change during the trade. If the spread is a credit spread, the maximum gain is the amount of the credit. If the spread is a debit spread, the maximum gain is the spread width less the debit.
Even though the maximum profitability of the credit spreads in our iron condor is fixed at expiration, a change in implied volatility while we are in the trade will affect the realized profit if we close the position early.
If the implied volatility of the options in our spread decreases markedly, the time decay curves in the risk/reward diagram collapse toward the curve at expiration. The practical effect is that if we close the spread early, we will collect a larger percent of our maximum gain.
Exactly the opposite effect occurs if implied volatility rises while we are in the trade. A gain in implied volatility will cause us to collect a smaller proportion of the maximum profit if we close the position early. This effect of implied volatility changes while in a spread accelerates the profitability of our iron condor spreads when volatility collapses after the announcement.
Option expiration selection
Option coaches often advise their students to buy more time than they need for their predicted move, e.g., I predict a five dollar rise in the stock XYZ within the next 30 days, so I buy a 60-day call option to provide some safety margin for my prediction to materialize.
In this case of playing the volatility move after the announcement, I plan to enter the trade on the day of the announcement and close it the next day because the implied volatility collapse will happen very quickly. In many ways, this is a binary trade. I either win or lose. Waiting and hoping won’t be wise.
If we inspect the option chain for the various expirations that follow the announcement, we will see the highest level of implied volatility for the options nearest to the date of the announcement. Returning to the earlier example with Apple announcing earnings on August 1, we could choose several weekly options or even the August and September monthly options for our position.
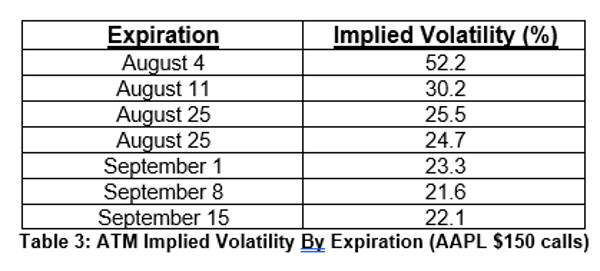
As we see in Table 3 below, implied volatility is elevated in the first two or three of these expirations, but it rapidly decreases to what might be called “normal” at the money (ATM) volatility for Apple. Thus, the maximum “bang for the buck” occurs with the option that expires just after the earnings announcement, the August 4 calls and puts. The expected decline in volatility after the announcement may be reasonably expected to be greatest for the options closest to the event.
From another perspective, the traders who are speculating on a price move for Apple don’t need much time in their options. In fact, they would prefer less time since that would be a cheaper option with less time value. It is the buying and selling activity of those speculators that has driven up the implied volatility of Apple’s options. And we see that effect most prominently in the near term options.
When we are playing the volatility decline after the announcement, we want the highest levels of implied volatility and we find those in the options expiring immediately after the announcement.
Strike price selection
Our objective is to choose strike prices that are unlikely to be reached after the announcement. The level of implied volatility provides critical information. Whenever I am considering a stock’s probable range of price moves after an earnings announcement, I price the at the money straddle with the options nearest expiration, in this example, the options expiring on Friday, August 4, just three days after the announcement.
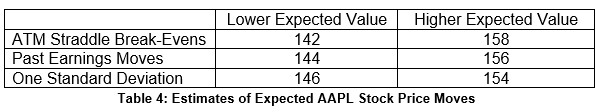
The Aug(8/4) 150 straddle was priced at about eight dollars on the afternoon of August 1, with break-evens at $142 and $158. This straddle price represents the consensus of all of the market participants buying and selling Apple options in anticipation of this announcement. They are expecting a price move as high as $158 and possibly as low as $142. This is the “expected move.”
On financial programs where market analysts are discussing the latest market activities, it is common to hear speculation about new product announcements or sales results that may influence the stock price after the earnings announcement. A common comment is “the market is expecting a 3% move.” The break-evens of the straddle provide those estimates of the expected move.
You may find this discussion of the expected price move a little surprising, but options are priced on a supply and demand basis.
Consider the reasoning of one hypothetical trader prior to the Apple announcement. She is bullish on Apple and is convinced Apple will trade up to $160 after the announcement, so she buys the $150 call option for $5 the week before the announcement. Her break-even is $155.
Over the next few days, the price of that call option rises to $7 and she is encouraged that her prediction is correct, so she buys more of the $150 call options. But on the day of the announcement, that call is selling for $10. Now the break-even is $160 and she is doubtful Apple will trade over $160 so she doesn’t buy additional calls.
This hypothetical example illustrates how the traders who are buying Apple options ahead of the announcement effectively price the options according to their expectations. Supply and demand determines a consensus price for the options that reflects the consensus predictions of the traders.
A critical question is whether you agree with the market’s consensus for the stock price move. If you think the expected price is too high or too low, you sell the straddle. If you judge the expected price is underestimating the move after the announcement, you buy the straddle.
When we are using the iron condor as a volatility trade, we are looking for the strike prices that we believe are outside of the expected range. Since volatility has been bid up with all of the speculation about the announcement, the options are expensive, so we sell the options and expect their value to collapse after the announcement, fueling our gains.
The break-evens of the ATM straddle give us one estimate of the expected move after the announcement. Another estimate may be made based on the price moves after previous earnings announcements. Using our broker’s web site, we can tabulate past stock price moves and convert them to percentage moves. Then we average those moves. For example, we might look at the past four earnings announcements for Apple and find that the average price move was 4%. Therefore, with Apple at $150 on the day of the announcement, we estimate a range of plus and minus 4% or $144 to $156, based on stock price moves after earlier earnings announcements.
Another expected price range could be computed by a probability calculation. Many traders will calculate the standard deviation, based on the current stock price, the average ATM implied volatility and a time period of one day. If we position our short strikes at plus and minus one standard deviation, we have established a condor with a probability of success of 84%. In this case with Apple, a one standard deviation move would have yielded a range of $146 to $154.
Table 4 summarizes the expected price moves from the various estimates.
Now the trader has to supply her own judgment based on her knowledge of the stock, prospects for the business, and her personal risk profile. That may lead to positioning the condor spreads inside or outside of some of the values from Table 4.
Another judgment call results when we price the spreads in the market. If the trader feels the credit received is too small at the strike prices she feels are safe, she may forego the trade. For the purposes of this example, we chose an iron condor spread positioned at 135/140 and 160/165, and that would have proven profitable. But the credits received were relatively small, yielding a six percent gain (but this was six percent in 24 hours). Some traders might have judged this too small for the risk exposure and taken a pass.
Other judgment calls may also apply. A good friend of mine plays strangles on earnings announcements every quarter and has done quite well over several years. But he has a list of “bad” stocks that he no longer uses for these trades. Those stocks have a record of having price moves after the earnings announcement that far exceed the expected moves.
Options traders must always be aware of the current levels of implied volatility in the options of the position under consideration, and also know the historical range of implied volatility for that stock.
Implied volatility changes are one of the critical risk factors for many options trades. As we have seen in this article, we may also use our predictions of implied volatility changes as the basis of our trade – we may play volatility.


