
In our next installment on the 50/50 Risk Parity Portfolio, Michael Rulle discusses how pension funds use the traditional 60/40 portfolio and why alternatives not always provide what they promise
In our series on Risk Parity, we have discussed the Invisible Gorilla Experiment, Benchmarks and the Efficient Frontier, the Tangency Portfolio and the Volatility Skew.
Here we discuss how pension funds lean on the tradition 60/40 portfolio and the role of alternatives.
The most traditional investment strategy, and the one that is most correlated to long term returns of pension funds, is the ubiquitous 60/40 strategy. According to Cliffwater LLC, 70% of State pension assets were invested in equities and fixed income with a ratio of 70% equities and 30% fixed income. On average, they invest 70% of their assets in public securities using a 70/30 split. As of 2018, according to Cliffwater, the remaining 30% of total assets of Pension Funds were in alternatives, increasing from 10% in 2006.
The National Association of State Retirement Administrators (NASRA) estimates that in 2018 there was a 68/32 split for those assets invested in public markets — which they derive from their latest Public Fund Survey. The Pew Research Center estimates a 65/35 allocation for 74% of Pension Fund assets. Pew estimates 26% of Pension assets were in alternatives.
Historically, according to Pew, the mix of pension fund assets has had an interesting trend over the last 67 years. In 1952, virtually 100% of assets were in fixed income. By 1982, 30 years later, 78% was in fixed income. Now, fixed income has declined to 20% and equity and alternatives are about 80%, virtually the exact opposite ratio of the highest Sharpe ratio portfolio. For those pension funds who invest in private equity, they invest almost 10% of their assets on average.
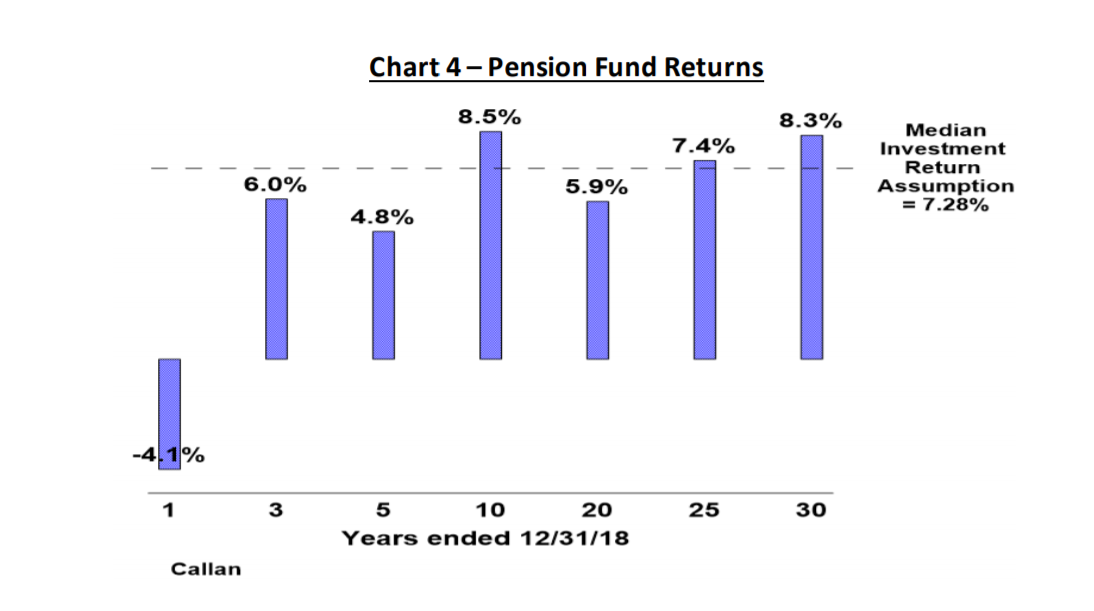
For those who invest in hedge funds — 7.7% of their assets on average — the median pension fund return, according to Callan Associates, measured more than seven different timeframes beginning in 1989 and ending Dec. 31, 2018. The chart below shows that the performance of pension funds, collectively, has been remarkably close to our stylized 60/40 returns of the S&P 500 and the 10-Year Treasury, with a 0.995 correlation for these seven different time frames. It is almost as if 60/40 were the pension fund portfolio. We recognize that the overlapping periods increases the correlation, however, returns are very similar to 60/40 for each period, regardless of timeframe.
Pew also quantified the large dispersion of performance for 44 very large state pension funds between 2007-2016. Both median performance and average performance were about 5.5%, but the range was between 3.8% and 6.8%. Nationally, 60/40 had virtually the same annualized return (6.71%) as the highest performer for this time frame. Even more sobering is that 50/50 Risk Parity had twice the Sharpe ratio as 60/40 for this same time frame. High dispersion of performance is also a clear indication that it is risky to engage in “outperformance” investing (i.e., the pursuit of alpha). This also gives credence to the idea that markets provide only zero-sum outcomes, relative to any benchmark. When investors are continually changing their investment profile into high correlated higher fee strategies, we should expect, and do get, these kinds of results.
We call this approach the equivalent of “counting passes” in our Gorilla metaphor. Pension fund investors, who seek to improve returns, are inadvertently framing their perception to find better returns in non-diversifying alternatives. They have been seeking to outperform by investing in relatively illiquid and opaque investments by replacing fixed income during one of the best fixed income periods in history and by moving away from the portfolio weighting that has the highest expected Sharpe ratio. They have moved consistently into private equities and other alternatives, which underneath it all, are correlated primarily to equities but with higher fee structures. This would be acceptable if institutional performance were better— but evidence shows otherwise. The chart above illustrates pension fund returns since 1989.
The comparable returns during these periods for 60/40 were -2.29%, 5.96%, 6.01%, 9.08%, 5.75%, 8.00% and 8.93%; 60/40 has outperformed pension funds in five of the seven-timeframes. Again, the correlation between pension fund returns and 60/40 for these timeframes, was 0.995.
Cliffwater also presents Pension fund 18- and 10-year asset weighted returns ending on June 30, 2018 instead of Dec. 31, 2018. The asset weighted 18-year return was 5.87% (60/40 was 5.90%) and the 10-year return was 6.49% (60/40 was 7.90%).
When one reflects on this, it should cause some alarm. Trillions of dollars, time, and manpower are invested in investigating high fee methods of investing, most specifically in private equities and hedge funds, and the results are questionable.
We do know there are “two free lunches” in the investment world: Diversification and low fees. We also know that greater diversification is provided to equities when combined with more risk-free or very high grade bonds, than with other forms of investments such as private equity, equity hedge funds, low grade debt and emerging markets. This does not preclude including these investments in a portfolio, but an ideal portfolio does require more risk-free or very high-grade fixed income securities, as well as strategies with lower fees. This is the opposite direction institutions have taken.
In our next installment, we will compare the performance of a 50/50 Risk Parity strategy to a traditional 60/40 portfolio.
Michael S. Rulle, Jr. is the founder and CEO of MSR Indices, LLC, a commodity trading advisor that offers an expansive range of index-tracking investment programs. This piece is an excerpt from a white paper titled: “The Gorilla in the Room: The obvious method of asset allocation most of us have never considered.”
Rulle inspired a family of indexes launched by S&P Dow Jones called S&P Risk Parity Indices, Rulle discussed Risk Parity at the 2019 TradersEXPO New York. Prior to founding MSR in 2015, he was president of Graham Capital Management, where he was directly responsible for the firm's discretionary portfolio managers.


