
The S&P 500 took out the April high on Friday and is nearing our 3000-3100 sell target, reports Al Brooks.
The E-mini S&P 500 appears strong, but 3,000 to 3,100 is a sell zone for at least a 10% pullback.
The E-mini S&P 500 futures went above the April high, triggering a monthly High 1 bull flag buy signal (see chart). The E-mini has been in a bull trend for 11 years. As big as the selloff was this year, it was only a two-bar pullback in a bull trend.
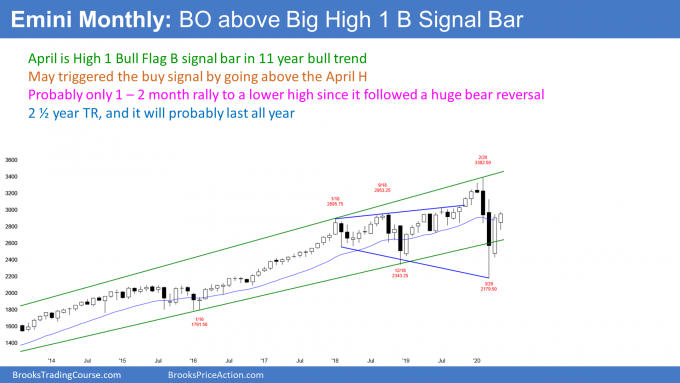
But, when a pullback is surprisingly big like that, traders expect at least a small second leg sideways to down. In 20% of cases, the second leg down begins after a brief new high. Consequently, traders believe that the E-mini will turn down for a month or two before making a new high. Therefore, the High 1 is a minor buy signal.
The month ends on Friday. When the range is small like this and there are important magnets nearby, there is an increased chance that the market will get drawn to a magnet at the end of the month. This is especially true in the final hour.
May so far is a bull bar. If it becomes a bigger bull bar, traders will expect at least slightly higher prices in June.
But if May closes below its midpoint or below the April high, traders will look for June to be more sideways. If May closes on its low, June will likely trade at least a little lower.
The E-mini S&P 500 futures reversed up in a V bottom from below the bottom of the two-year trading range (see weekly chart below). It has stalled at the 20-week exponential moving average.
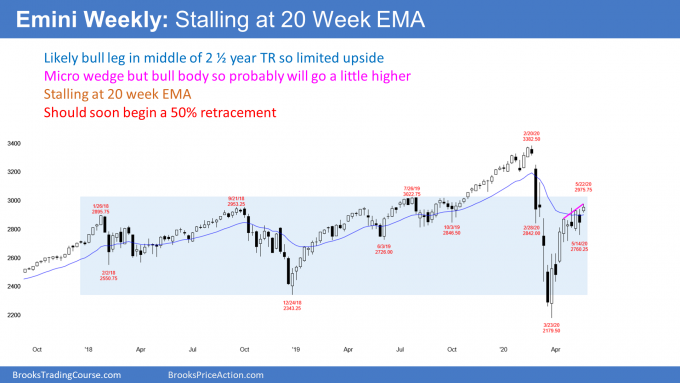
Furthermore, the price action changed four weeks ago when a doji formed. That is a bar with a small body and a big tail. A big tail below means that the market sold off and then rallied. That is two-sided trading.
The significance is that there was a strong enough selloff to create a tail on the bar. A doji is a strong bull trend is an early sign that the strong trend is losing momentum. Traders begin to think about a trading range.
The rally sometimes continues for five to 10 more bars before there is a big enough reversal down to begin a trading range. But once it does reverse down, the minimum target is a test of the bottom of the doji.
Sometimes, instead of continuing up, the E-mini begins a trading range with that doji bar. That is what has happened in this case. There has only been one big bull trend bar in the past five weeks. The other bars have had small bodies and big tails. Also, the bars have mostly overlapped one another.
Rally losing momentum
While there have been a couple new highs since that doji of five weeks ago, they have been brief. There can still be another leg up from here without much of a pullback. But if there is, it will probably only last a few weeks. Additionally, it will likely be only a bull leg in a trading range that began with that doji four weeks ago.
Micro wedge increases chance of pullback
Last week was the third high in the past six weeks. There is now a micro wedge on the weekly chart. Last week is a sell signal bar, but it had a bull body. It is therefore a weak sell signal bar. Traders expect that there will be buyers below this week’s low.
The one caveat is that Friday is also the end of the month. If there is a strong reversal down by the end of the week, there will be a sell signal bar on the monthly chart. That would erase the bullishness of last week’s bull close.
It is important to note that the two-month bull channel is tight. Consequently, if there is a reversal down in June, it should be minor in the sense that it will probably not fall below the March low. Traders will look for a couple legs down for a month or two and expect a higher low.
A selloff often retraces about half of the rally. Therefore, the E-mini will probably fall to 2,600 to 2,700 in June. But, as I said, traders will buy the selloff. They expect at least a small second leg up after a 35% rally in two months.
The E-mini futures broke above the April wedge top last week on the daily chart (see below). When there is a breakout above a top, in general, there is a 50% chance of a trend up and a 50% chance of a failed breakout and another attempt at a top.
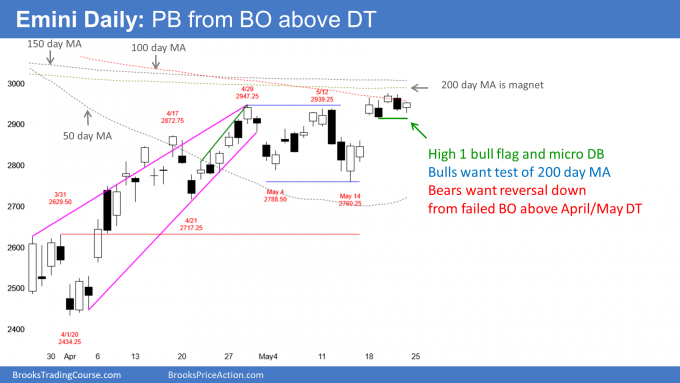
But the probability for the bulls is higher here. There are magnets above, the bull trend is strong, and Friday closed near its high. Traders expect next week to go at least a little higher. The 200-day moving average is the minimum goal.
The E-mini spent the week oscillating around the April high. When May went above the April high, the E-mini triggered a buy signal on the monthly chart.
Traders are deciding if the breakout above the April high will succeed or fail. If May closes far above the April high, traders will expect higher prices in June. They will expect sideways to down trading in June if May closes around or below the April high.
If there is a trend up, traders will look for a measured move up based on the height of the month-long trading range. The target would be just above the March 3 lower high.
That March 3 lower high is very important. It was the end of the first pullback after the February collapse. That makes it the start of the March parabolic wedge sell climax.
Reversals typically test the start of the last leg down
When the E-mini reverses up from a Spike and Wedge Bear Channel like this, the rally typically works its way to the start of the channel. At that point, traders expect the bull trend to evolve into a trading range.
So, the measured move target based on the three-week double bottom is at a very important price. Also, the rally is extreme. Yet, it followed a huge bear trend. There will probably be a second leg sideways to down. A test of the March 3 high would be a good location for the start of that second leg down.
The Sell Zone is between 3,000 and 3,100
The rally does not have to make it all the way to the March 3 high before exhausting itself. It is near enough now for traders to see it as a satisfactory test. They would be more convinced that the bulls have exhausted themselves if the rally was closer to the March 31 high.
However, the E-mini could still begin a 50% selloff from this week’s high or just a little higher. The 200-day simple moving average is an important magnet and it is only about 15 points above this week’s high.
The E-mini will probably have to get there before it reverses down. So, the sell zone is between the 200-day moving average around 3,000 and the March 3 high, around 3,100. Bulls will take profits there and the bears will begin to short.
It is important to note that the March collapse was 35% and the May rally is now 35% above the March low. Markets like symmetry, and this is another factor that works against the bulls near-term.
Bear legs in trading ranges typically fill gaps
A 10% correction is a reasonable goal for the bears. However, the E-mini has been in a trading range for 2.5 years. Selloffs typically fall below breakout points.
The April rally broke strongly above the March 31 high. That high is therefore the breakout point. There is a gap above that high and below the April 21 pullback. Gaps in trading ranges usually get filled.
At some point this year, the E-mini should fall below that high of 2629.50. Since that is near the 2600 Big Round Number, traders should expect a test of 2,600 this year. It could come in the next couple months.
The top of the range for the remainder of the year will probably be around the March 3 high. That was the start of the parabolic wedge sell climax. The start of the climax usually gets tested and then there is typically a leg down.
There are a couple other important prices that I have not mentioned in a few weeks. When the E-mini fell 10% from the high, it entered a correction. That price is 3,054.38, which is in my 3,000 to 3,100 sell zone.
When the E-mini fell 20%, it entered a bear market. That is 2706.00. There is a 70% chance that the E-mini will test below that level before the end of the year. When it does, the news will be that the stock market is back in a bear market. As I said many times, I think it will fall below the March 31 high of 2629.50 because that is a breakout point.
Therefore, a rough guide of where the E-mini will probably be for the rest of the year is between 10% and 20% down from the high. That is approximately between 2,600 and 3,100. Traders will likely look to buy when it’s around 2700 and sell when it is above 3,000.
Trading Room
Traders can see the end of the day bar-by-bar price action report by signing up for free at BrooksPriceAction.com. I talk about the detailed E-mini price action real-time throughout the day in the BrooksPriceAction.com trading room. We offer a two-day free trial.


