
Joon Choi breaks down seasonal tendencies in the S&P 500.
The year 2020 feels a lot like 2009 when the stock market bottomed in March and the recession ended a few months later, except that this year everything is happening much more quickly.
The S&P 500 Index fell 34% in less than five weeks from Feb. 19 to March 23, and then reclaimed a new high on Aug. 18 (less than five months after the bottom). Both the selloff and rebound was the fastest bear market and recovery ever. Technology stocks are benefitting from the exploding demand for remote working/schooling/consulting capabilities.
I want to shed some light on what to expect for the remainder of the year based on historical data and answer the question whether to chase the current rally.
Historical data
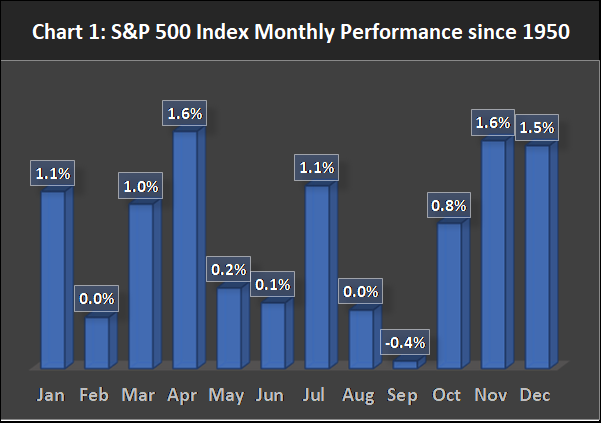
The S&P 500 gained 7% last month, which is the most profitable August since 1986 (when the index appreciated 7.1%). However, back then SPX gave up all its gains in the following month. Equities are also exhibiting some volatility in early September. As shown in Chart 1, September is the worst-performing month (-0.4%) since 1950. Moreover, there are more 1% or greater daily swings in October than any other months despite decent average performance of 0.8%.
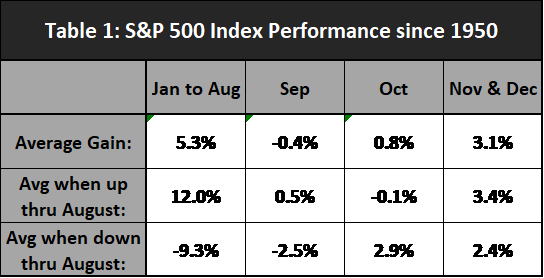
The S&P 500 Index was up 8.3% as of Aug. 31, and I thought it warranted finding out if a positive return during the first eight months has any effect on the remaining months. So, I separated the monthly returns into four categories: January to August, September, October and November and December.
SPX gained 5.3% from January to August, -0.4% in September, 0.8% in October and 3.1% during November and December. However, if I isolate the years in which SPX had positive returns through August, September was slightly positive (0.5%) and October was slightly negative (-0.1%), approximately a 1% improvement and 1% deterioration respectively from all periods. When SPX is lower after the first eight months, it averaged -2.5% in September and 2.9% in October. Based on these averages, we should see a slightly positive return in September and October (See Table 1, below).
Digging Deeper
Although seasonality tells us to expect a somewhat flat period for the next two months and then a sharp rise in November and December, the figures are averages and are not predictive. For example, in 2018 SPX was down 7.4% during the final two months after posting positive returns through August. So, I analyzed six corrections (greater than a 10% loss) since stocks bottomed in March 2009 to learn what we might expect after the most recent correction in the Q1. Table 2 (below) summarizes the corrections with the following information:
- Selloffs – depth of the selloff in percentage.
- Recovery Date – when SPX exceeded the peak prior to the correction.
- Recovery Time (months) – number months it took to fully recover from the correction.
- Number of months without gains – maximum number of months SPX showed no gains after it recovered its most recent correction.
- Max Gain – maximum gain during the period from when the market first hit a new post-correction high and when it revisited that breakout level.
- Max drawdown – maximum drawdown incurred during # of months without gains.
The figure below illustrates how these six quantities are measured from the stock price data.
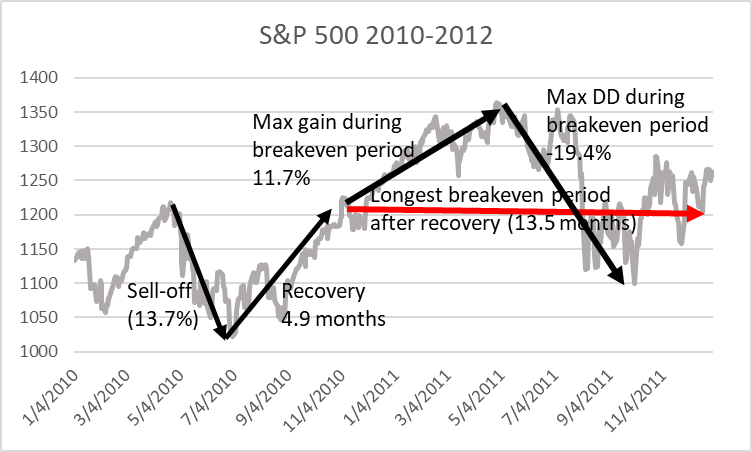
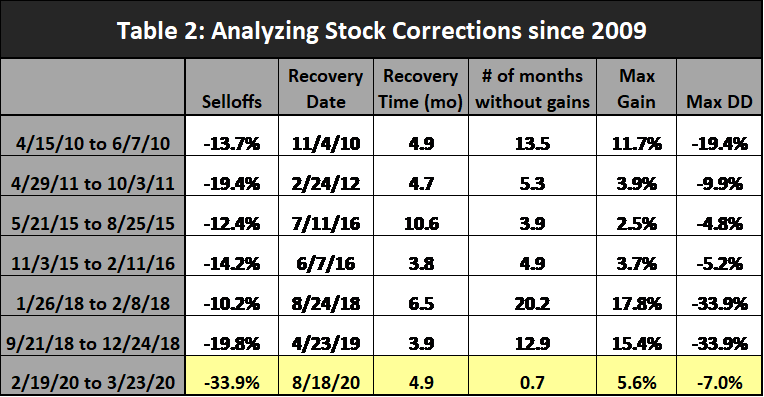
The first correction of 13.7% started on April 15, 2010, and lasted until June 7, 2010, and SPX recouped all its losses on Nov. 4, 2010. SPX was flat 13.5 months after the recovery, but it was up 11.7% from the recovered level at one point. Lastly, there was a 19.4% drawdown during the 13.5 months that SPX was flat. As of the Sept. 9, 2020, close, SPX is up 0.27% from its most recent recovery date (August 18), which indicates the index was “flattish” for the past 0.7 month. SPX was up as much as 5.6% from its recovery level on Sept. 2 but then had a 7% drawdown. So, what does this research imply? It shows that after recovering from corrections, SPX was flat anywhere from 3.9 to 20.2 months later. If history serves as a guide, we may see the index revisit the Aug. 18 level (3,389.78) in the months ahead.
Conclusion
Past seasonality statistics suggest that stock returns may be minimal in September and October. Uncertainties surrounding the Covid-19 pandemic’s effect on global economies, availability of safe vaccines, and the US presidential election are leading to a wide dispersion of year-end SPX targets by Wall Street strategists. It may be prudent to be cautious and not chase the current rally since my research suggests that the S&P 500 Index may have a hard time meaningfully staying above 3,389.78 level on Aug. 18.
If stocks are headed sideways, then strategies such as covered call positions, high dividend yielding stocks, and riskier corporate bonds (both high yield and floating rate) should serve you well. Please be advised that this study does not say that SPX will be flat for an extended period but rather you will have the chance to add equity exposure to your portfolio at the current level in the months ahead. So, why not wait until some of the uncertainties are addressed before increasing equity exposure?
Joon Choi is senior portfolio manager/research analyst at Signalert Asset Management. Sign up here for a free three-month subscription to Dr. Marvin Appel’s Systems and Forecasts newsletter, published every other week with hotline access to the most current commentary. No further obligation.


