
The stock market has been increasingly volatile of late. But until proven otherwise we are witnessing a rotation not a full market correction, states Joe Duarte of In the Money Options.
Of course, this scenario could change at any time. Certainly, the biggest problem for stocks right now is that of finding new leadership. But aside from the crash in tech stocks and the lack of new leadership emerging, there may be more to the stock market’s troubles than meets the eye. And much of the recent selling may be related to the recent crash in Bitcoin (BTCUSD) and related margin calls.
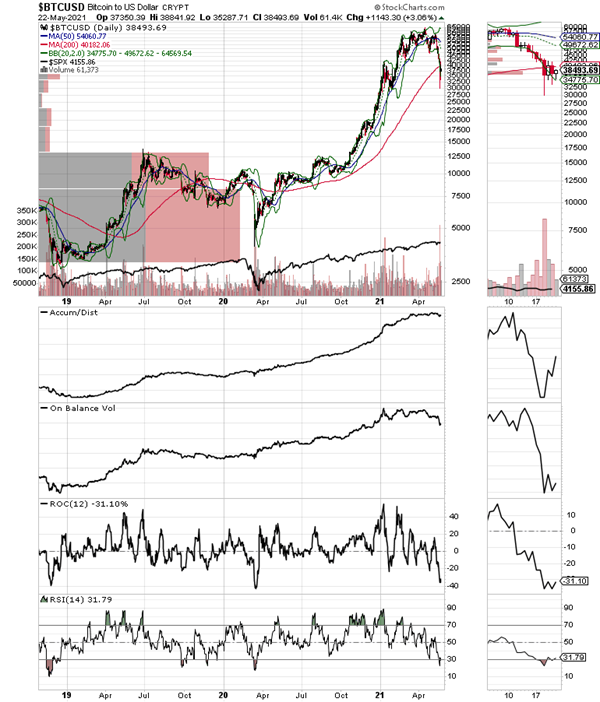
It’s clear that Bitcoin and the related crypto universe is playing a significant role in the ebb and flow of money in the financial markets these days. And while this isn’t the place nor the time to discuss the pros and cons of cryptocurrencies, it’s worth noting that since 2019, major market bottoms, pauses in rallies, and the general trend if not necessarily the intensity of the moves of both BTC (upper candlestick line upper panel) and the S&P 500 (SPX), lower linear line, upper panel) have had a clear and still present correlation, which suggest an emerging, even if difficult to sort out, intermarket relationship.
So now that BTC is testing its 200-day moving average as SPX gyrates in an uncomfortable trading range it will be interesting to see what happens next. Specifically, BTC is way oversold with RSI hovering near 30 as it tests its long-term uptrend. These types of technical readings at major turning points for BTC in the past have marked preludes to significant rallies. So, the question is what will happen to SPX if BTC is able to rebound and embark on a new rally?
At the moment Accumulation Distribution (ADI) on BTC is ticking up but On-Balance Volume (OBV) is still weak. ROC is algo trying to find a bottom. All of this adds up to the pause in BTC being due to short covering. However, if the short covering turns into real buying as it did during similar episodes in 2019 and 2020, the odds would favor yet another rally in the cryptocurrency.
It is also interesting that as BTC has crashed, options volatility near key strike prices for the SPDR S&P 500 ETF (SPY) have been equally volatile. Moreover, the presence of these phenomena combined with the reversal of several key investment themes that have been prominent over the last few months have increased the market’s volatility of late and suggest that there is a connection between money flows in all these different asset classes.
In other words, it seems that margin calls in BTC may have at least contributed to the selling in leading stocks and that hedging and jockeying for position in the options market are all par for the course as algos try to manage risk. Thus, it is plausible that if things straighten out in BTC, we may see a more orderly stock market—i.e.,a resumption of the Fed QE-fueled rally in stocks.
Options Suggest Market Indecision and Market Rotation Not Finished
Last week, I noted that the presence of a large number of “amazing price charts and bullish directional movement in the options of a good number of stocks outside of the mainstream,” and I decided to “stick my neck out and suggest” that we were seeing a rotation out of the larger stocks and into smaller and midcap niche stocks.”
I also noted that I was “still cautious because options expiration data from the week ending on 5/14/21” suggested “that the 415-420 strike price areas for SPY” still held the key for the market.” All of which meant “that if put buyers and stock sellers (took) over again we could see an acceleration of the selling.”
Finally, I added that “a sustained and well-supported break above 420 on SPY (was) likely to lead to higher prices. Meanwhile, a failure at 420 and a break below 415 (would) likely lead to resumption of the down trend.”
In fact, what we saw on the week that ended on 5/21 was more of the same with SPY ending the week just below 415 after failing to take out the 420 area convincingly while breaking down to the 406 area temporarily. Moreover, as has been the case of late, by week’s end the put buyers again overwhelmed the call buyers at 415 leaving SPY to close at an indecisive 414.94. This type of action suggests that put buyers forced market makers who sold them the puts, to sell stock index futures and stocks in order to hedge against losses. And on a cautionary note, the Monday May 24 weekly SPY expirations could be more of the same as put buyers ended the week well ahead of call buyers.
And if you want more in depth options analysis that you can put to use in your daily trading you can catch me live and in Person at The MoneyShow in Orlando in June. Register here.
Valvoline: Greasing the Skids for New Up Leg
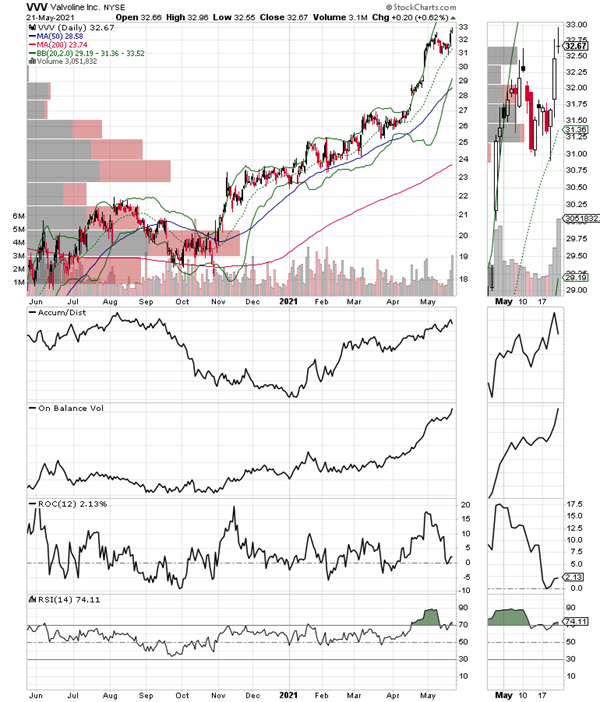
I recommended shares of Valvoline (VVV) in mid-April when the price was near $27. Since then, the stock is up nearly 20%. Moreover, it has shown a good deal of relative strength during a very volatile market period, which suggests that the stock is likely to have some upside left.
Best known for its motor oil, Valvoline is actually expanding its revenue and earnings base by growing the number of Valvoline Instant Oil changing centers. And the strategy is working.
In fact, the company recently announced a restructuring of its business into a service-oriented division built around its oil-changing centers and its traditional global motor oil and lubricant business. The company’s most recent earnings call featured beats of revenues and earnings as well as delivering a positive outlook based on growing revenues and earnings from its oil- changing centers, which they also recently expanded by the purchase of more oil-changing centers. Altogether the company expects 18 to 20% sales growth in the current fiscal year.
The stock is a bit overbought now but is not showing signs of being sold aggressively. In fact, Accumulation Distribution (ADI) and On-Balance Volume (OBV) suggest money is moving in as the stock attempts a breakout above the $33 level. There is good support near $31, which can be used to enter the stock on any dips.
I own shares in VVV as of this writing.
NYAD Recovers After Midweek Rout
The New York Stock Exchange Advance Decline line (NYAD) remains in a volatile consolidation pattern but the uptrend has not been broken yet.
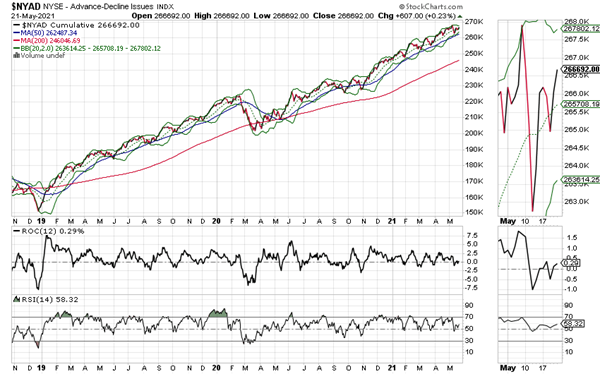
This is because as long as NYAD continues to make new highs, remains above its 50- and 200-day moving averages and its corresponding RSI reading remains above 50, the trend remains up. This combined set of observations has been extremely reliable since 2016 and shows no signs of becoming unreliable as of this writing.
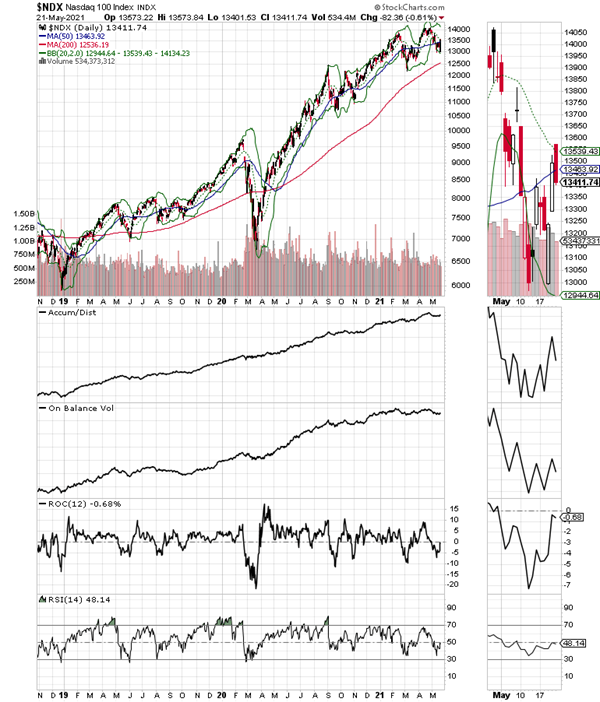
The story is slightly different in the Nasdaq 100 index (NDX), which ended the week just below its 50-day moving average. This is very disappointing as the index failed to fully capitalize on the oversold reading of 30 RSI on the prior week. Still, NDX is still trading above the 13,000 area and there is a potential W bottom in place if NDX can move higher without a retest of the recent lows.

The S&P 500 showed a bit of resilience during the recent selloff as it held at its 50-day moving average and the Accumulation Distribution (ADI) and On-Balance Volume (OBV) indicators did not break down. The index remains above its 20-, 50-, and 200-day moving averages.
To learn more about Joe Duarte, please visit JoeDuarteintheMoneyOptions.com.


