
While the XIV has yet to break, this initial crack has already provided two very nice long Volatility trades, of which, profits have been banked and costs have been removed, writes Mike Golembesky, an Elliott Wave analyst who covers volatility indexes and forex.
Get Trading Insights, MoneyShow’s free trading newsletter »
This week the VelocityShares Daily Inverse VIX Short Term ETN (XIV) continued to grind higher finally reaching a high of 96.98 on Wednesday afternoon (July 26). This high was followed by a very small move to the downside late in the day.
Thursday morning saw a slight recovery but by the noon lunch hour, the XIV started showing signs of weakness. By 12:30 the XIV began to move sharply lower finally bottoming at the 89.28 level, some 7.5% off of the high of the day.
This move was rather short lived, however, and the XIV did manage to recover most of the losses incurred during the session, finally closing out the day down just 1.5%.
Anecdotal and other sentiment indications
Last week I discussed some of the records that the CBOE Volatility Index (VIX) had set in 2017. I also discussed the CBOE S&P 100 Volatility Index (VXO) symbol which is a more accurate way to compare the current VIX to pre-2003 levels.
One of the most impressive records that the VIX had set in 2017 was the total number of days that it had closed under the 10 level. At the time of last week’s writing, this number stood at a total of thirteen, with six of those coming in the six consecutive trading sessions leading into last Thursday’s close.
The streak continued into this week and did not end until Thursday, leaving the VIX with ten consecutive under 10 closes. This brought the total number this year to seventeen; this is more than four times all of the previous years combined.
So, while the streak was indeed broken on Thursday, it wasn’t broken by much. By the end of the trading session, the VIX had moved all the way back down to the 10.11 level from an 11.50 intraday high. This 10.11 close did, however, give the VIX another under 11 level close bringing this year’s total up to 63.
Equally impressive was what the VXO did this past week as it closed in the 7s for the first time in history last Friday. It followed this up with two additional under 7 closes on Monday and Wednesday of this week, and on Tuesday the VXO closed at an all-time low of 6.32!
Thursday, the VXO hit an intraday high of 9.50 but moved back lower and closed at 8.39, which was still makes the top ten list for all time lowest closing levels.
While the VIX did indeed end its streak of closing under 10, Volatility levels are still very low and have quite a bit of work to do before they are out of the basement.
Price pattern sentiment indications and upcoming expectations
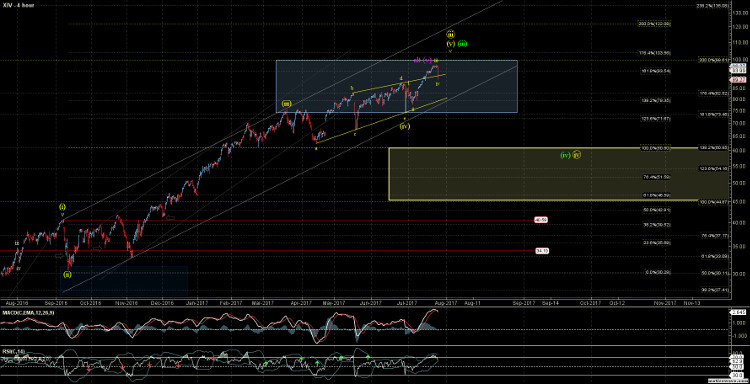
In last week’s article, I had noted that the XIV was following a fairly clear impulsive wave pattern up off of the June 30 low. At the time of that writing, the XIV was trading just over the 93.25 level.
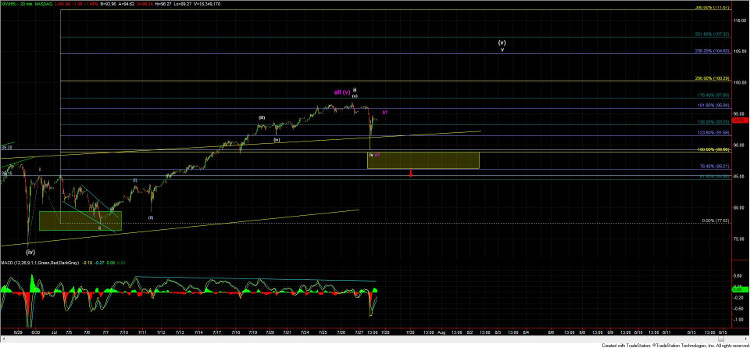
I was ideally looking for the XIV to head up towards the mid-90s prior to topping but I was keeping a close eye on the support zone that was indicated in the yellow box on the 20-minute charts.
Although the move down on Thursday was quite sharp, it did manage to hold over the upper end of the yellow support box which now sits at the 88.90-86.21 zone. Furthermore, the move down off of Wednesday’s high still counts best as a corrective move.
This leaves the door open to still take the XIV back over the 96.98 high and potentially even over the 100 level prior to making its final larger degree top. The XIV would have to hold the 86.21 level to leave this scenario reasonably probable. I would view a break of that 86.21 level as the initial signal that the XIV has already topped in its larger degree third wave.
Once this does top in this larger degree third wave I expect to see this correct down towards the 60.85 – 44.85 zone prior to bottoming and once again resuming the larger bullish trend moving the XIV higher once again in 2018.
So, while the XIV has yet to break, this initial crack has already provided two very nice long Volatility trades, of which, profits have been banked and costs have been removed.
I am now off the sidelines and into the game. I am still left with plenty of dry powder and am patiently waiting for the next setup to come.
See charts illustrating the wave counts on the XIV.
Subscribe to Elliott Wave Trader here…