

If Democrats force the Republicans to shut the government down temporarily, the market will likely sell off. This is a precarious time for the market, and there is an increased risk of the 5% correction beginning around the December 8 vote, asserts Al Brooks.
Monthly S&P500 Emini futures candlestick chart:
13 months without a pullback
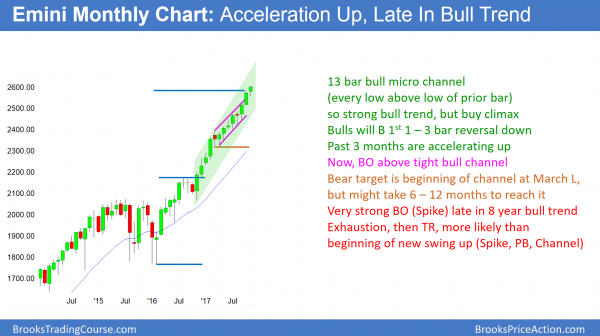
The monthly S&P500 Emini futures candlestick chart has not had a pullback in 13 months. With 4 days remaining in November, this month so far is a small bull bar. If it closes below its high, it would represent a loss of momentum after 2 strong bull bars.
The monthly S&P500 Emini futures candlestick chart has not had a pullback in 13 months. This has never happened in the 18-year history of the Emini. It only happened once in the history of the S&P Cash Index (SP500). That was in 1995 at the start of the strongest bull trend in 50 years. The 14th month fell below the low of the 13th month, and then the bull trend resumed after that one-month pullback. The S&P tripled over the next 5 years. The one bar pullback was about 4.6% from the high.
If November remains a small month, a pullback below its low would require only about a 50-point selloff from the all-time high. That is only 2%. Because the buy climax is so extreme, the pullback will probably be deeper. Furthermore, it might last several months. If it tested the beginning of the tight channel that started in March, it would fall about 100 points and 5%.
Bull micro channel is created by strong bulls
A 13 bar bull micro channel is a strong bull trend. It could therefore easily continue for many more months before pulling back. However, since the S&P has never been this overbought, the odds are against this rally continuing much longer without at least a small pullback.
Since the rally is strong, the bulls will buy the pullback. That is true even if it lasts 6 months and reaches 20%. There is only a 20% chance of a major reversal after a tight bull channel without at least a micro double top.
It’s the close that matters
This month is currently a strong bull trend bar. However, there are 4 days left in November. In addition, the open of the month is only about 20 points lower. Therefore, this month could easily close back at the open. That would turn the month into a doji bar after 2 big bull bars. It would be a sign of a loss of momentum after a 2 bar climax in a bigger climax. Traders would see it as a possible start of a pullback. It would be a sell signal bar for the bears in December.
If the month closes near its low on Thursday, this month would be a bear reversal bar in a buy climax. That would make December likely to trade below the November low. If it did, it would officially be a pullback and the end the 13 bar bull micro channel. Because the bull trend is so strong, the odds are that the pullback will last only 1 – 3 months before the bulls buy again.
If there was then a rally back up to the November high, the bears would try to get a 2nd reversal down. That small double top would then have a 40% chance of growing into a TBTL (Ten Bar, Two Leg) correction. Hence, it could be the start of a trading range that could last about a year. The odds that more than a 20% or more correction would begin within the next few months are only about 30%.
Weekly S&P500 Emini futures candlestick chart:
Breakout above weak buy signal in extreme buy climax
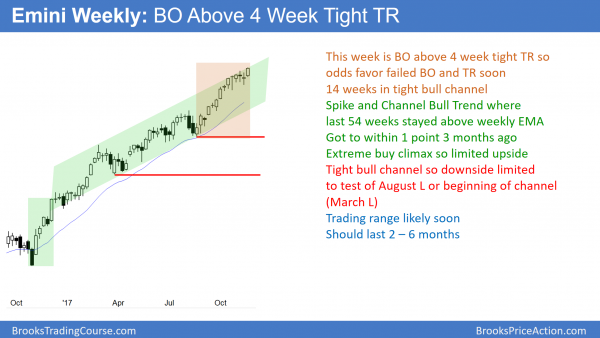
The weekly S&P500 Emini futures candlestick chart this week broke above last week’s high. Since last week was a pullback in a bull trend, it was a one bar bull flag. However, it was a doji, which usually does not lead to a strong rally.
The weekly S&P500 Emini futures candlestick chart has not touched its 20-week exponential moving average in 54 weeks. That has never happened in the Emini, and it happened only once in the history of the S&P500 Cash Index. During the strong 1995 bull breakout, the weekly chart of the S&P500 cash index held above its 20 week EMA for 62 weeks. This was during that 13-month bull micro channel that I mentioned above.
The 20 week EMA is just below 2520. A pullback would have to be at least 80 points. That would be getting close to the August 8 high, which is a magnet on the daily chart. This is consistent with the approximately 5% correction that is likely on the monthly chart.
One week pullback so small bull flag
Last week (ending Nov. 24) was a bull bar and it broke above the previous week’s high. Since the previous week was a pullback in a bull trend, it was a buy signal bar. However, it was a doji bar and therefore a low probability buy signal bar. In addition, 5 of the past 6 bars were doji bars. A doji bar contains at least one reversal. When there is a series of doji bars, there is an increased chance of other dojis (1 bar reversals) and 2 bar reversals. That a bull bar has an increased chance of leading to a bear bar, creating a 2 bar reversal.
The tight trading range represents a balanced market. Breakouts of tight trading ranges usually do not go far. Therefore, this breakout is likely to not be as strong as all of the other breakouts since March. Yet, markets have inertia. This means that they have a strong tendency to continue to do what they have been doing. Since the weekly chart has been in a tight bull channel, the odds will continue to favor at least slightly higher prices.
However, the extreme buy climax should begin to pull back to the 20 week EMA soon. While a chart never has to pull back to its average price, that has never happened. Hence, the pullback will come. Furthermore, markets are based on rational human behavior and therefore patterns repeat. Consequently, the odds are high that the Emini will begin to pull back within a month or two. Yet, until there is a clear reversal, the odds continue to favor at least slightly higher prices.
Daily S&P500 Emini futures candlestick chart:
Trump corporate tax cut rally might stall with budget vote
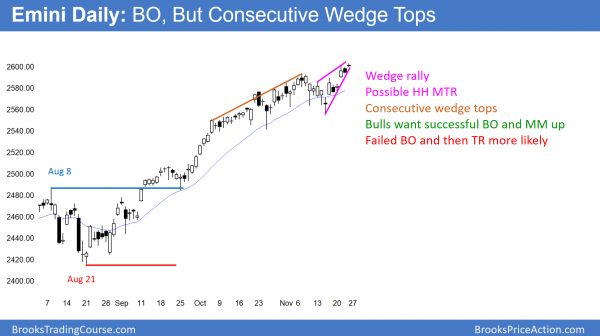
The daily S&P500 Emini futures candlestick chart broke above a 7 bar bear channel this week. In addition, it broke above a month-long tight trading range to a new all-time high. Yet, it has consecutive wedge tops, and this 2nd one is also a higher high major trend reversal.
The bull breakout on the daily S&P500 Emini futures candlestick chart lacked consecutive bull bars closing on their highs. Furthermore, the breakout to a new high was a breakout above a month-long tight trading range. A tight trading range late in a bull trend is often the final bull flag. Consequently, the rally will probably not go far before reversing back into the tight trading range.
Longest streak without a 3% correction
The daily chart of the S&P500 Cash Index has not had a 3% correction in 256 bars. That is the longest streak in 90 years, and probably in history. The odds are that it will have at least a 3% correction beginning soon. A 3% correction would be about 75 points. That would be about 40 points above the August 8 high.
Since that breakout point was only tested briefly by the September 25 low, and that day was only a small doji bar, many traders believe the test was not reliable. Therefore, the odds favor another test below that high. That would require about a 115 point pullback. This would be about a 5% correction, which is what is likely on both the weekly and monthly charts.
Consecutive wedge tops
Wedge tops are common in bull trends, but most lead to bull flags. The 7-day rally has 3 legs and is in a converging channel. It is a wedge. Moreover, it is a higher high major trend reversal. Friday was a doji and it is a sell signal bar for next week. If Monday (Nov. 27) trades below Friday’s low, it will trigger the sell signal.
There have been many other sell signals over the past 6 months, and there has been something wrong with every one of them. This signal bar and the wedge top both are good enough for a credible top.
The bears need to create selling pressure
The bears need to create many signs of strength (selling pressure) before traders will believe that this reversal attempt is different from all of the others. For example, if Monday is a big bear day closing near its low, it would be a strong sell entry bar. It that happens, the bears would next want Tuesday to be a strong follow-through day. That means that the bears would like consecutive big bear bars. In addition, the bigger the bear bars are and the closer they close to their lows, the more traders will begin to see the reversal as possibly more than a pullback into another bull flag.
While everyone knows that a 5% correction is likely soon, betting on any one reversal as the start is a low probability bet. However, one of these reversals will start to look like the bears are taking control. Traders will be ready for a swing down only after they see evidence that this selloff is different from all of the others.
Because this is a second consecutive attempt at a wedge top (the November 7 high was the first), it has a higher probability of leading to at least a TBTL (Ten Bars, Two Legs) pullback. Since there are extreme buy climaxes on the daily, weekly, and monthly charts, there is an increasingly likely chance that a pullback will grow into a 5% correction. Yet, until the bears get consecutive big bear bars, the odds still favor every reversal failing and the bull trend continuing.
Bull trends are tough on the bears
Everyone knows that the Emini will correct at some point. Yet, the bulls keep buying every selloff, no matter how strong. Look at the daily chart. There have been many big bear bars. But what do they all have in common? There has been no follow-through selling. Until there are consecutive big bear bars, the odds are that the bulls will continue to buy every strong selloff. The bears continue to buy back their shorts, and many are taking repeated losses.
Once everyone agrees that the daily chart has flipped to Always In Short, the selloff will already be half over. This is because traders want to see at least 2 consecutive big bear bars closing near their lows. That will probably require a drop of at least 50 points from the all-time high.
Since many bulls will buy around 2500, which is also a 100 point and 5% pullback, the selloff will probably end around there. Consequently, by the time everyone is confident of a test of the 2500 support level, the selloff will already be half over.
This is common when a bull trend reverses. It takes a lot to convince traders that a reversal is a correction and not another bull flag. Yet, the monthly chart is so bullish that any selloff will probably not be too deep. Hence, by the time the daily chart is clearly bearish, the monthly bulls will begin to look to buy and the selloff will soon end.
Congress votes on December 8 to pass a spending bill
Markets always look to catalysts. Most have no significant effect. However, the market is as extremely overbought. Therefore, traders know that a correction is likely soon. Consequently, they will watch for reactions to catalysts. An important one comes on December 8.
That is when Congress has to vote to pass a spending bill to avoid a government shutdown. The problem with the vote is that it requires 8 Democrats in the Senate to reach the 60 vote threshold to avoid a filibuster. In addition, the Democrats know that the public always blames Republicans for government shutdowns because they know that the Republicans try to reduce spending.
This gives the Democrats leverage, especially since the Republicans can pass the tax bill without any votes from the Democrats. The Democrats will be particularly eager to get something from the spending bill after getting nothing in the tax cut bill.
If they force the Republicans to shut the government down temporarily, the market will likely sell off. If they extract other symbolic or real concessions that hurt corporations, the market might sell off as well. Therefore, this is a precarious time for the market, and there is an increased risk of the 5% correction beginning around the December 8 vote.
Traders can see the end of the day bar-by-bar price action report by signing up for free at BrooksPriceAction.com.


